Figures & data
Table 1 The Sequences of Primers for RT‑PCR Used in This Study
Figure 1 CircSPATA6 was downregulated in OSCC serum samples and cells. (A) RT-qPCR assay was employed to assess circSPATA6 in 46 OSCC serum samples and 25 normal samples. (B) Receiver operating characteristic (ROC) curve analysis revealed that circATRNL1 was capable of distinguishing OSCC patients from healthy controls. Area under the ROC curve (AUC) =0.7748, 95%, confidence interval (CI) = 0.6496 to 0.9. (C) The expression level of circSPATA6 was detected in human oral keratinocyte (HOK) and OSCC cell lines (CAL-27, HSC6, UM1, and SCC9). (D and E) Relative RNA levels of circular SPATA6 and linear SPATA6 were tested in CAL-27 and HSC6 cells treated with or without RNase R+. (F and G) Relative RNA level of circular SPATA6 and linear SPATA6 were measured in CAL-27 and HSC6 cells by using Random primers or Oligo (dT)18 primers. *P <0.05.
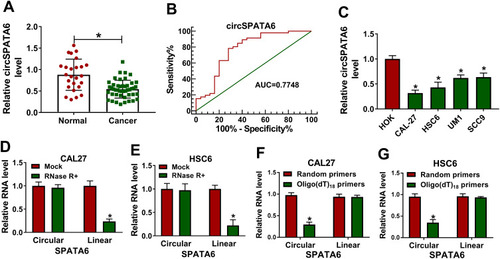
Figure 2 CircSPATA6 overexpression suppressed migration, invasion, cell cycle, and promoted apoptosis of OSCC cells. CAL-27 and HSC6 cells were transfected with Blank, pcDNA, and circSPATA6. (A) The expression level of circSPATA6 was examined in transfected CAL-27 and HSC6 cells. (B) Wound healing assay was applied to detect migration rate in transfected CAL-27 and HSC6 cells. (C) Transwell assay was performed to assess invasion in transfected CAL-27 and HSC6 cells. (D and E) Flow cytometry assays were conducted to examine cell cycle distribution and apoptosis rate in transfected CAL-27 and HSC6 cells. *P <0.05.
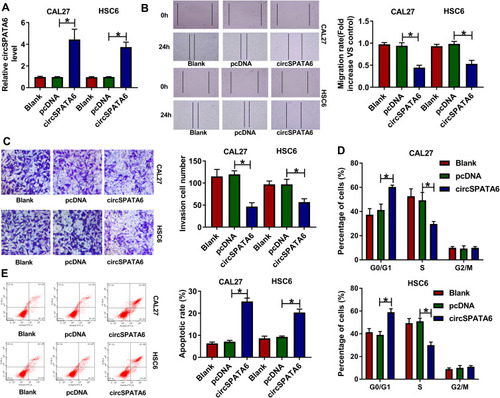
Figure 3 MiR-182 was a direct target of circSPATA6. (A) Circular RNA interactome was employed to predicate the interaction between circSPATA6 and miR-182. (B and C) The underlying relationship was verified using dual-luciferase reporter assay. (D and E) RIP assay was conducted in CAL-27 and HSC6 cell extracts to examine miR-182 endogenously associated with circSPATA6. (F) Relative miR-182 level was detected in HOK, CAL-27, HSC6, UM1, and SCC9 cells. (G and H) MiR-182 level was examined in CAL-27 and HSC6 cells transfected with Blank, pcDNA, circSPATA6, si-con, si-circSPATA6. *P <0.05.
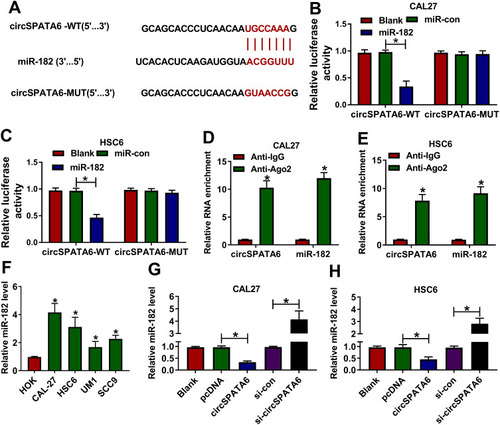
Figure 4 MiR-182 directly bound with TRAF6. (A) Putative binding sequences between miR-182 and TRAF6-3ʹUTR, and mutant sites in TRAF6-3ʹUTR reporter. (B and C) Dual-luciferase reporter assays were applied to verify the prediction between miR-182 and TRAF6-3ʹUTR. (D and E) The interaction between miR-182 and TRAF6-3ʹUTR was proved by RIP assays. (F) Western blot assay was conducted to detect the protein level of TRAF6 in HOK, CAL-27, HSC6, UM1, and SCC9 cells. (G and H) TRAF6 protein level was assessed in CAL-27 and HSC6 cells transfected with Blank, miR-con, miR-182, in-miR-con, and in-miR-182. *P <0.05.
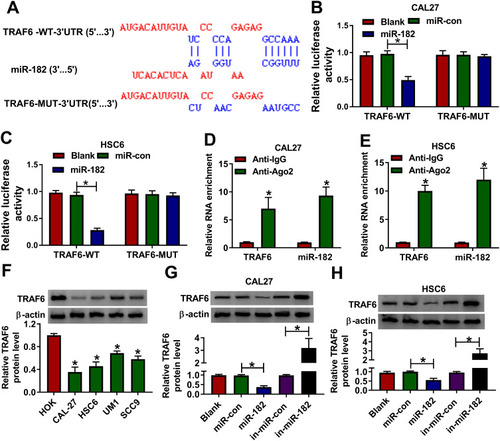
Figure 5 Overexpression of miR-182 overturned the inhibitory effect of circSPATA6 on OSCC progression. CAL-27 and HSC6 cells were transfected with pcDNA, circSPATA6, circSPATA6 + miR-con, and circSPATA6 + miR-182. (A and B) Relative miR-182 level was measured in transfected CAL-27 and HSC6 cells. (C and D) Migration ability was examined in transfected CAL-27 and HSC6 cells. (E and F) Invasion capacity was detected in transfected CAL-27 and HSC6 cells. (G and H) Cell cycle distribution was determined in transfected CAL-27 and HSC6 cells. (I and J) Apoptosis rate was assessed in transfected CAL-27 and HSC6 cells. *P <0.05.
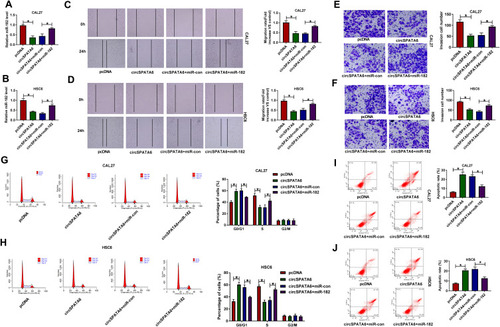
Figure 6 The suppression action of miR-182 knockdown on OSCC progression was reversed by the downregulation of TRAF6. CAL-27 and HSC6 cells were transfected with in-miR-con, in-miR-182, in-miR-182+si-con, and in-miR-182+si- TRAF6. (A and B) TRAF6 protein level was detected in transfected CAL-27 and HSC6 cells. (C and D) Migration rate was detected in transfected CAL-27 and HSC6 cells. (E and F) Invasion was assessed in transfected CAL-27 and HSC6 cells. (G and H) Percentage of cells was measured in transfected CAL-27 and HSC6 cells. (I and J) Apoptosis rate was analyzed in transfected CAL-27 and HSC6 cells. *P <0.05.
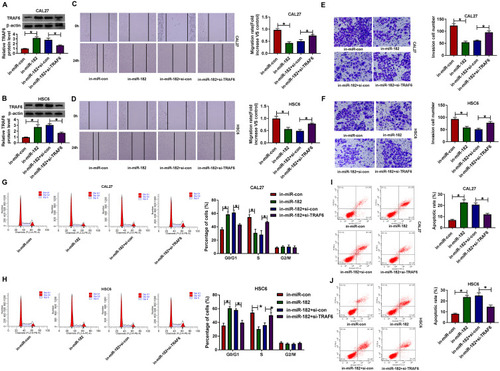
Figure 7 CircSPATA6 repressed tumor growth in OSCC in vivo. CAL-27 cells transfected with Blank, pcDNA, and circSPATA6 were subcutaneously injected into the nude mice. (A) Growth curve of the xenografted tumor. (B) Weights of resected tumor masses. (C and D) The mRNA levels of circSPATA6 and miR-182 in xenografts were measured. (E) TRAF6 protein level was examined. *P <0.05.
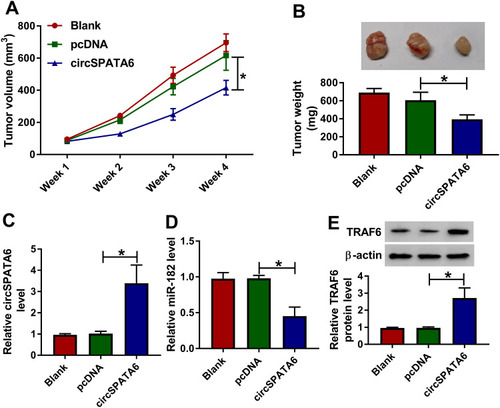
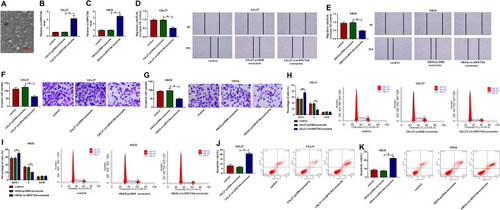
Figure 8 Exosomal circSPATA6 inhibited the growth of OSCC cells. (A) A transmission electron microscope was used to detect the morphology of exosomes. (B–K) exosomes were isolated from CAL-27 and HSC6 cells transfected with pcDNA or circSPATA6, and then, co-cultured with transfected CAL-27 and HSC6, respectively. (B and C) Relative circSPATA6 level was detected in exosomes from un-transfected or transfected CAL-27 or HSC6 cells. (D and E) Migration rate was measured in exosomes from un-transfected or transfected CAL-27 or HSC6 cells. (F and G) Invasion cell number was examined in exosomes from un-transfected or transfected CAL-27 or HSC6 cells. (H and I) The percentage of cells was analyzed in exosomes from un-transfected or transfected CAL-27 or HSC6 cells. (J and K) Apoptosis rate was assessed in exosomes from un-transfected or transfected CAL-27 or HSC6 cells. *P <0.05.