Figures & data
Table 1 Clinicopathological Features of the Study Patients
Figure 1 (A and B) show images from the pre-enhancement and the HB phases (20 min after injection of the contrast agent) for a 56-year-old male patient. The HB phase is hypointense. (C and D) The images of a 40-year-old male patient at the pre-enhancement and HB stages. The HB stage showing iso- or hyperintense images.
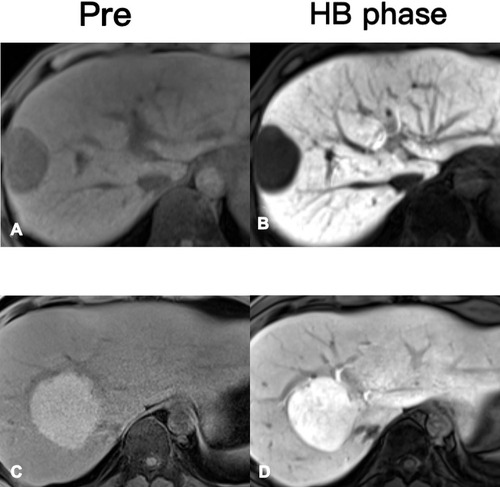
Figure 2 (A) WD HCC, (B) MD HCC, and (C) PD HCC.
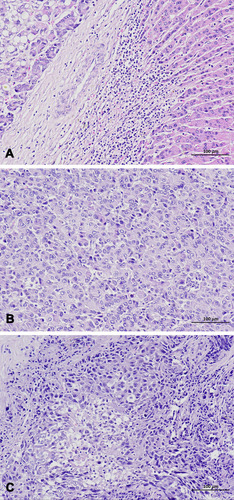
Figure 3 Graph showing tumor differentiation. The hypointense HCCs (hypo) consisted of well- differentiated (n = 6), moderately differentiated (n = 46), and poorly differentiated HCCs (n = 7), while 80% (n = 8) of hyperintense HCCs (iso/hyper) were moderately differentiated.
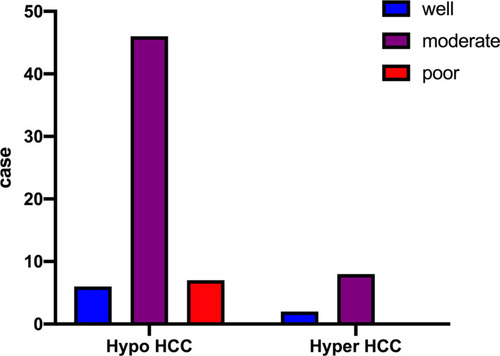
Figure 4 The expression of OATP1B3 at different signal intensities of the 2 groups. The expression in the iso- or hyperintense groups is significantly higher than that in the hypointense group (*P < 0.05).
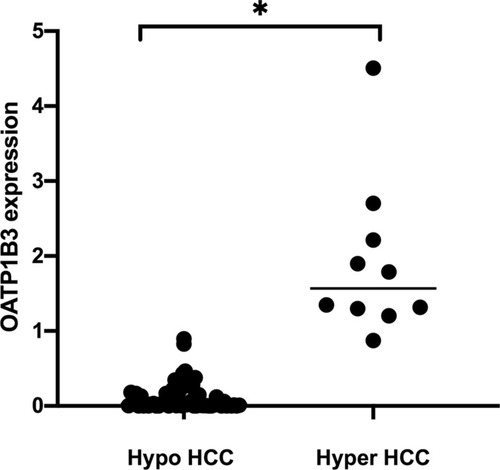
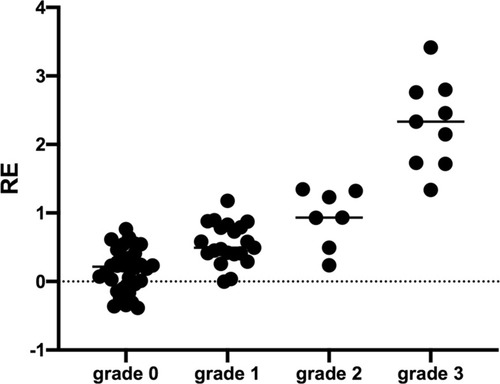
Figure 5 The relationship between the expression of transporter OATP1B3 and the enhancement rate (RE) in the HB phase. We found that the OATP1B3 expression was proportional to the RE in the HB phase. As the OATP1B3 expression increased, the enhancement rate in the RE phase also increased (R = 0.747, P < 0.01).
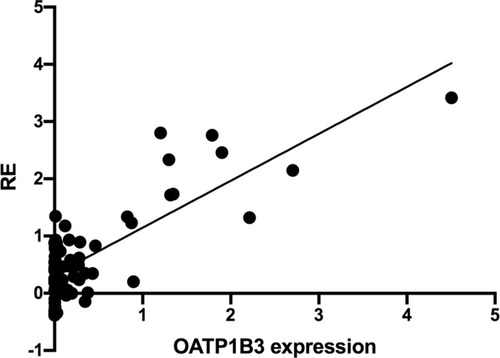
Figure 6 A bar graph showing the results of semiquantitative analysis of the immunohistochemistry of OATP1B3 (*P < 0.05).
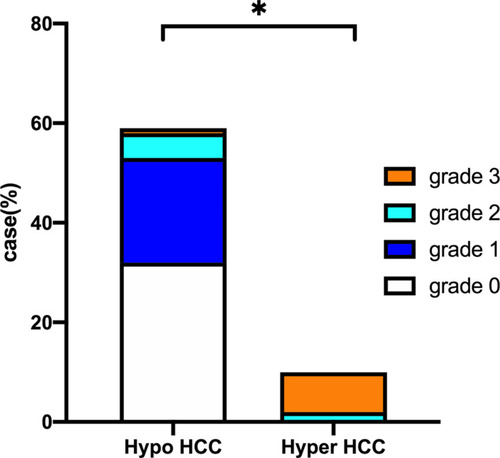
Figure 7 (A and B) An HCC patient with iso- or hyperintense images at the HB stage. The expression of OATP1B3 is significantly higher than that of the background liver. (C and D) An HCC patient with hypointense images at the HB stage. The expression of OATP1B3 in HCC is basically not expressed and is significantly lower than that of the background liver.
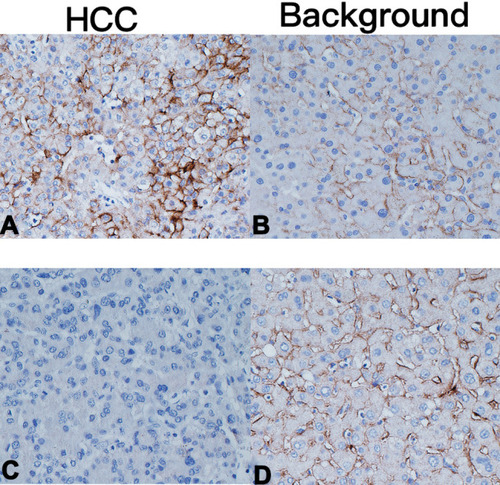
Figure 8 The relationship between the expression of transporter OATP1B3 and the RE of the HB phase. The expression of OATP1B3 relative to that in background liver was significantly related to the SI of the HB phase. As the expression of OATP1B3 increased, the RE of the HB phase also increased (P < 0.05).