
Figures & data
Table 1 Patient Characteristics
Table 2 The Response Rates for Different Treatment Regimens
Figure 1 Kaplan-Meier survival curve of advanced stage ENKTL patients.
Notes: (A and B) The progression-free survival (PFS) (A) and overall survival (OS) (B) of all patients. (C) The progression-free survival in the CHOP and L-asp groups. (D) The overall survival in the CHOP and L-asp groups. (E) The progression-free survival in the SMILE and GELOXD groups. (F) The overall survival in the SMILE and GELOXD groups.
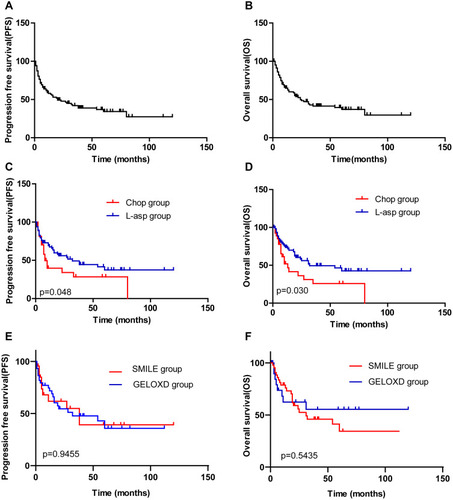
Figure 2 Significant impact of primary involved site, IPI score and PINK score on the survival outcome.
Notes: (A) The progression-free survival in the UAT and NUAT groups. (B) The overall survival in the UAT and NUAT groups. (C) The progression-free survival in the low-IPI and high-IPI groups. (D) The overall survival in the low-IPI and high-IPI groups. (E) The progression-free survival in the low-PINK and high-PINK groups. (F) The overall survival in the low-PINK and high-PINK groups.
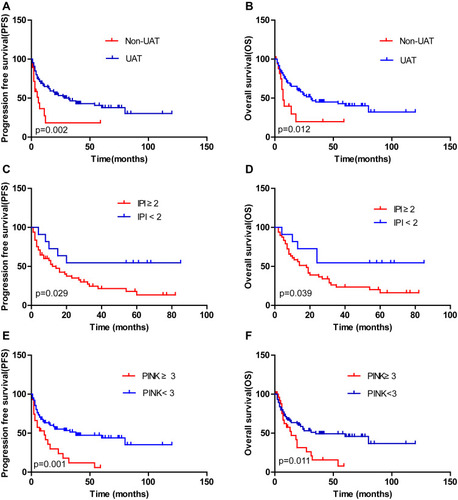
Table 3 Univariate and Multivariate Analysis of Prognostic Factors for Survivals (by Cox Regression)
Table 4 Grade 3/4 Toxicity That Occurred in the Two Groups