Figures & data
Table 1 Clinical Implications of Response to Therapy Reclassification in Patients with Differentiated Thyroid Cancer Treated with Total Thyroidectomy and Radioiodine Remnant Ablation
Table 2 General Data of PTC and PTMC and the Relationship Between Lymph Node Metastasis and Treatment Response
Figure 1 With the stage from N1a to N1b and the number of lymph node metastases increasing, the percentage of ER gradually decreased and the percentage of NER gradually increased.
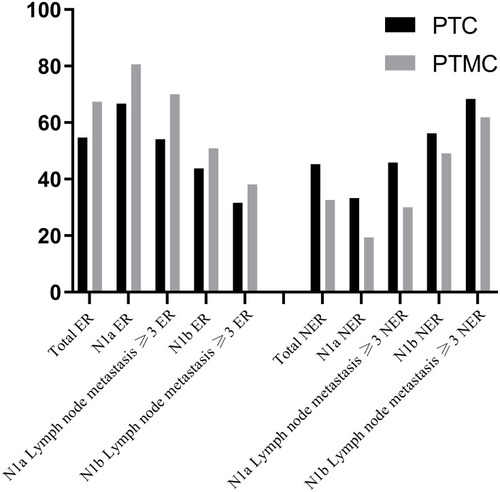
Table 3 Comparison of PTC and PTMC After Being Divided into ER and NER Groups
Table 4 Multivariate Logistic Regression Analysis on the RAI Treatment Response in PTC and PTMC
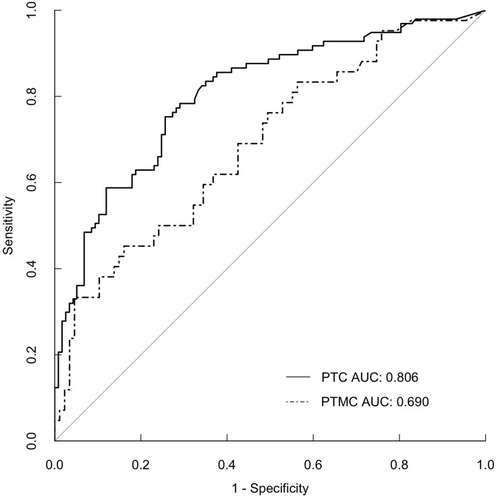
Figure 2 ROC curve of the relationship between ps-Tg and RAI response in patients with PTC and PTMC.