Figures & data
Table 1 Genetic Alterations in the Three Adenoid Cystic Carcinomas
Figure 1 Genetic alterations of the presented multiple ACC lesions.
Abbreviations: LLL, left lower lobe; RML, right middle lobe; RLL, right lower lobe.
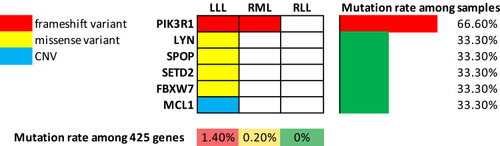
Table 2 Overlapped Top 10 Upregulated GO Terms in the Three Malignant Tumours
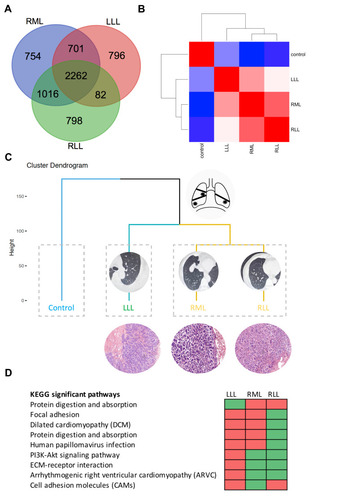
Figure 2 Transcriptome-assisted origin assessment of multiple ACC lesions. (A) The Venn diagram visualized the number of differential gene expression in the three tumors. (B) Heatmap of differential gene expression correlation matrices. (C) Hierarchical clustering and principal component analysis of gene expression profile. (D) KEGG signaling pathway analysis of DEGs in three tumors. Cells in green indicate the signaling pathways are significantly enriched, while cells in red mean the pathways are not activated.
Abbreviations: LLL, left lower lobe; RML, right middle lobe; RLL, right lower lobe; KEGG, Kyoto Encyclopedia of Genes and Genomes.