Figures & data
Table 1 Primers
Figure 1 Circ_0000629 expresses poorly in BC tissues and cell lines. (A) a volcanic map showing differentially expressed circRNAs in GSE147985; (B) a volcanic map showing differentially expressed circRNAs in GSE92675; (C) the differentially expressed circRNAs in two datasets were intersected to obtain circ_0000629; (D) expression of circR_0000629 in cancerous and paired adjacent tissues from 57 BC patients by RT-qPCR; (E) expression of circR_0000629 in normal bladder uroepithelial cells and BC cell lines by RT-qPCR. In panel D, each dot represents a sample case. Date are mean ± SD, n = 3. ***p < 0.001 (paired t-test).
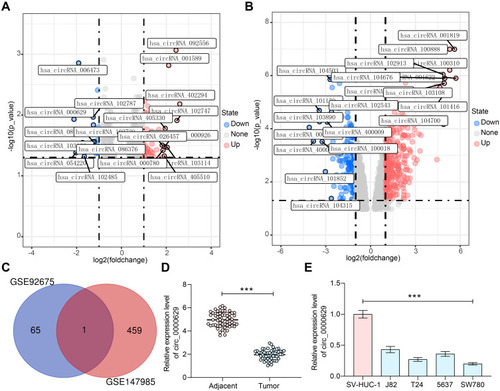
Figure 2 Overexpression of circ_0000629 inhibits the growth of BC cells in vitro. Overexpression plasmid of circ_0000629 was transfected into T24 and SW780 cells. (A) circ_0000629 expression in the cells examined by RT-qPCR; (B) CCK-8 assay to detect the activity of T24 and SW780 cells; (C) EdU staining for proliferative capacity of T24 and SW780 cells; (D) flow cytometric analysis of apoptotic T24 and SW780 cells; (E) Caspase-3/7 kits detection of caspase-3/7 activity in T24 and SW780 cells; (F) expression of apoptosis-related proteins PUMA, Bax, and Bcl-2 in cells examined by Western blot. Date are mean ± SD, n = 3. *p < 0.05, **p < 0.01, ***p < 0.001 (two-way ANOVA and Tukey’s multiple comparison test).
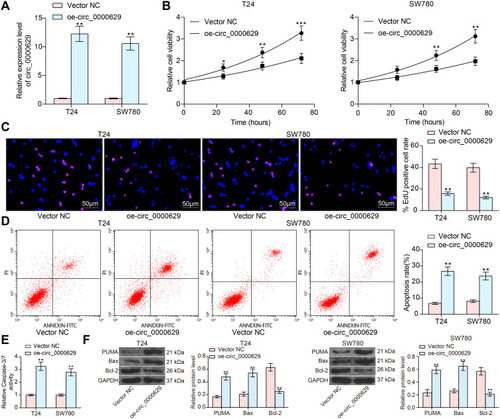
Figure 3 Overexpression of circ_0000629 inhibits aggressiveness of BC cells in vitro. (A) mRNA expression of EMT-related factors in T24 and SW780 cells detected by RT-qPCR; (B) protein expression of EMT-related factors in T24 and SW780 cells detected by Western blot; (C) the migration capacity of T24 and SW780 cells examined by Transwell assay; (D) the invasion capacity of T24 and SW780 cells examined by Transwell assay. Date are mean ± SD, n = 3. **p < 0.01 (two-way ANOVA and Tukey’s multiple comparison test).
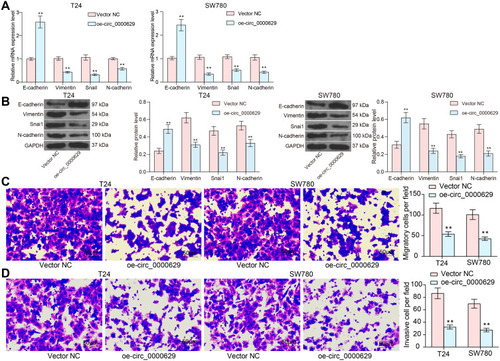
Figure 4 Circ_0000629 is localized to the cytoplasm of BC cells. (A) subcellular localization of circ_0000629 in T24 and SW780 cells was detected by fractionation and export assay; (B) subcellular localization of circ_0000629 in T24 and SW780 cells confirmed by FISH experiments. n = 3. **p < 0.01.
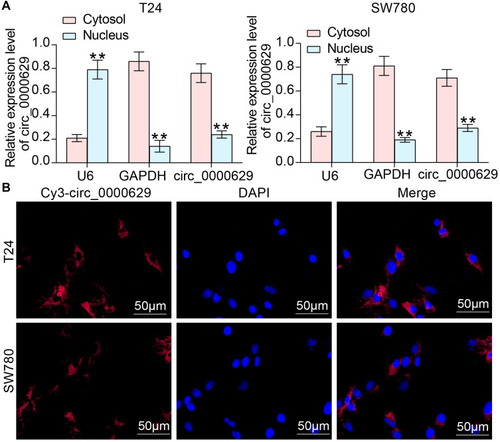
Figure 5 Circ_0000629 interacts with miR-1290 in BC cells. (A) differentially expressed miRNAs in BC microarray GSE113486; (B) the intersection of the target miRNA of circ_0000629 predicted by circbank website and the miRNAs upregulated in the GSE113486 microarray; (C) RT-qPCR detection of miR-1290 expression in cancerous and paired adjacent tissues from 57 patients with BC; (D) Pearson’s correlation analysis of miR-1290 and circ_0000629 expression in 57 BC patients; (E) expression of miR-1290 in bladder uroepithelial cells and BC cell lines detected by RT-qPCR; (F) expression of miR-1290 in T24 and SW780 after overexpression of circ_0000629 detected by RT-qPCR; (G) the interacting relationship between miR-1290 and circ_0000629 validated by dual-luciferase experiments. Date are mean ± SD, n = 3. **p < 0.01, ***p < 0.001 (two-way ANOVA and Tukey’s multiple comparison test).
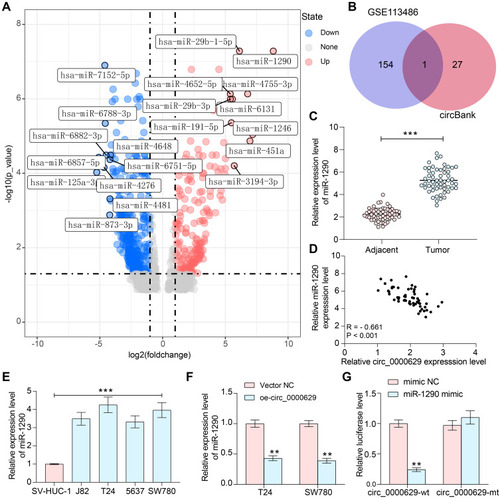
Figure 6 miR-1290 mimic promotes the growth and aggressiveness of BC cells in vitro. T24 and SW780 cells were co-transfected with oe-circ_0000629 + miR-1290 mimic or oe-circ_0000629 + mimic NC. (A) expression of miR-1290 in cells after co-transfection by RT-qPCR; (B) EdU staining for proliferative capacity of T24 and SW780 cells; (C) flow cytometric analysis of apoptotic T24 and SW780 cells; (D) expression of apoptosis-related proteins PUMA, Bax, and Bcl-2 in cells examined by Western blot; (E) the migration capacity of T24 and SW780 cells examined by Transwell assay; (F) the invasion capacity of T24 and SW780 cells examined by Transwell assay. Date are mean ± SD, n = 3. **p < 0.01 (two-way ANOVA and Tukey’s multiple comparison test).
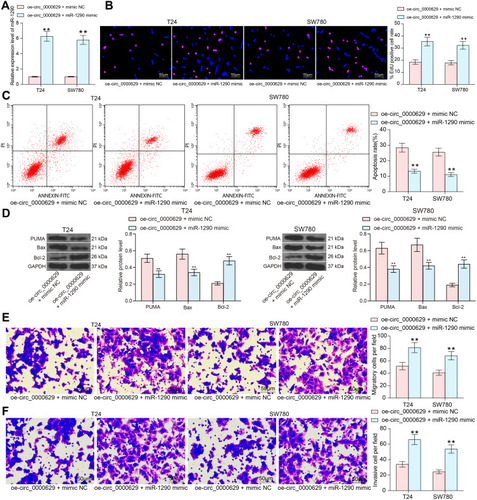
Figure 7 miR-1290 targets and negatively regulates CDC73. (A) a volcanic map showing differentially expressed mRNAs in GSE86411; (B) a heatmap showing differentially expressed mRNAs in GSE86411; (C) the intersection of the target mRNA of miR-1290 predicted by TargetScan and miRDB websites and the mRNAs downregulated in the GSE86411 microarray; (D) RT-qPCR detection of CDC73 expression in cancerous and paired adjacent tissues from 57 patients with BC; (E) Pearson’s correlation analysis of CDC73 and circ_0000629 expression in 57 BC patients; (F) Pearson’s correlation analysis of CDC73 and miR-1290 expression in 57 BC patients; (G) expression of CDC73 in bladder uroepithelial cells and BC cell lines detected by RT-qPCR; (H) mRNA expression of CDC73 in T24 and SW780 after overexpression of circ_0000629 and/or miR-1290 mimic detected by RT-qPCR; (I) protein expression of CDC73 in T24 and SW780 after overexpression of circ_0000629 and/or miR-1290 mimic detected by Western blot; (J) the binding relationship between miR-1290 and CDC73 validated by dual-luciferase experiments. Date are mean ± SD, n = 3. ***p < 0.001 (paired t-test) or **p < 0.01 (two-way ANOVA and Tukey’s multiple comparison test).
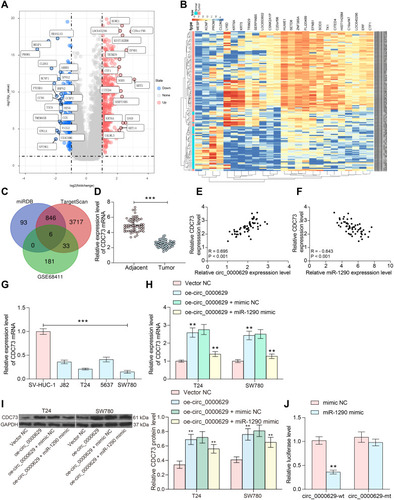
Figure 8 Knockdown of CDC73 attenuates the inhibitory effect of oe-circ_0000629 on BC cells. T24 and SW780 cells were co-transfected with oe-circ_0000629 + shScr, oe-circ_0000629 + shCDC73-#1 or oe-circ_0000629 + shCDC73-#2. (A) mRNA expression of CDC73 in cells after co-transfection by RT-qPCR; (B) protein expression of CDC73 in cells after co-transfection by Western blot; (C) EdU staining for proliferative capacity of T24 and SW780 cells; (D) flow cytometric analysis of apoptotic T24 and SW780 cells; (E) expression of apoptosis-related proteins PUMA, Bax, and Bcl-2 in cells examined by Western blot; (F) the migration capacity of T24 and SW780 cells examined by Transwell assay; (G) the invasion capacity of T24 and SW780 cells examined by Transwell assay. Date are mean ± SD, n = 3. **p < 0.01 (two-way ANOVA and Tukey’s multiple comparison test).
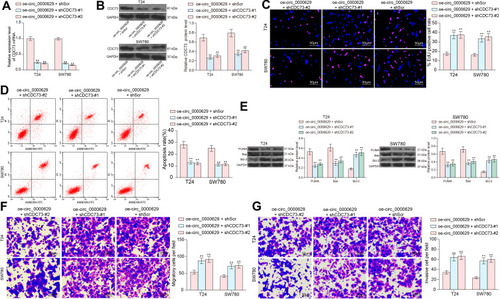
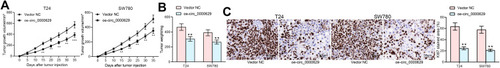
Figure 9 Overexpression of circ_0000629 inhibits the growth of BC cells in vivo. T24 and SW780 cells transfected with oe-circ_0000629 were delivered into nude mice (n = 6). (A) tumor volume was calculated at an interval of 5 days; (B) weight of tumors at day 35; (C) staining intensity of KI67 in tumor tissues examined by immunohistochemistry. Date are mean ± SD. **p < 0.01 (two-way ANOVA and Tukey’s multiple comparison test).