
Figures & data
Figure 1 Study flow diagram.
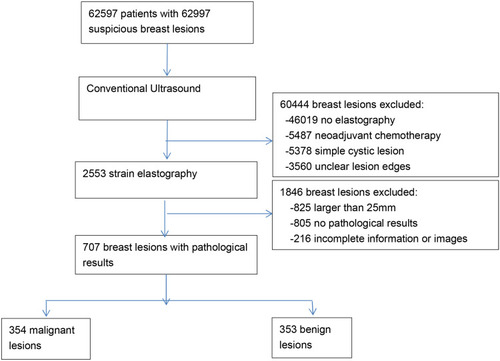
Figure 2 Invasive ductal carcinoma grade II in a 50-year-old woman. (A) Greyscale US image showed an irregular hypoechoic mass. (B) Color Doppler showed the blood flow was abundant in the mass. (C and D). Elastographic image showed the lesion scored 5, and ROI (A) was drawn along the margin of the lesion, and its strain was recorded. The ROI (B) and ROI (C) were selected at the normal glandular tissue, which reflected the strain of glandular tissue. ROI (B) was small (≤3.1mm2) and ROI (C) was as large as ROI (A). SR1 was 4.77 (C), and SR2 was 6.32 (D).
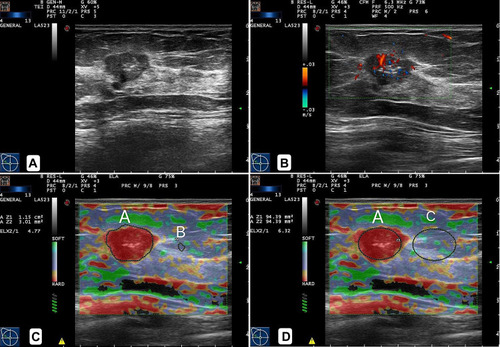
Table 1 Pathological Diagnoses in 707 Breast Lesions
Table 2 Distribution of Malignant and Benign Tumours for BI-RADS 1–5
Table 3 Distribution of Malignant and Benign Tumours for Elasticity Score 1–5
Table 4 Elasticity Parameters in Malignant and Benign Lesions
Table 5 Diagnostic Performances of Different Elasticity Parameters
Figure 3 A scatter plot showing the correlation between SR1 and SR2, with a positive correlation coefficient of r = 0.821 (R2 = 0.674).
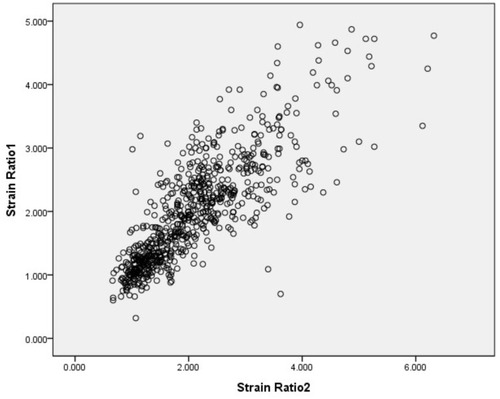
Figure 4 Elasticity ratios according to elasticity score. Boxplot graphs demonstrated the strain ratio was closely related to the elasticity score. (A) As the elasticity score increased, the SR1 value increased. (B) As the elasticity score increased, the SR2 value also increased.
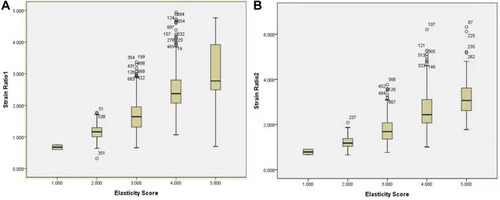
Figure 5 Receiver operating characteristic curves for different elasticity parameters. (A) The Az value of elasticity score (0.806) was significantly higher than that those of SR1 (0.763) and SR2 (0.756) (P < 0.001). However, there was no significant difference between the Az values of SR1 and SR2 (P = 0.569). (B). There was no significant difference between the Az values of BI-RADS combined with ES (0.817), BI-RADS combined with SR1 (0.809), and BI-RADS combined with SR2 (0.799) (all P values > 0.05).
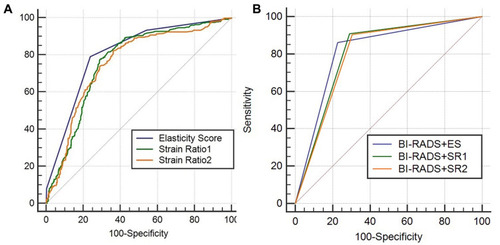
Table 6 Relationships Between Strain Ratios and Clinicopathological Features in Invasive Carcinoma