Figures & data
Figure 1 A representative example of a metaphase spread with normal chromosome 1 (A), translocation (B), acentric fragment (C), deletion (D), and insertion (E) detected by fluorescence in situ hybridization (FISH) using whole chromosome paints.
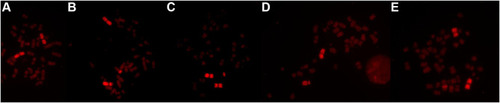
Table 1 The Mean Cellular Biomarkers Evaluated for PCa and BPH Patient Cells Irradiated with X-Rays
Table 2 The Mean Frequency of Endogenous and Exogenous Chromosome 1 Aberrations Found in vivo, Evaluated in Non-Irradiated Cells from PCa and BPH Patients
Table 3 Comparison of Cellular Radiosensitivity of Chromosome 1 Aberrations Obtained for PCa and BPH Patients, After Stratification by Cancer in the Immediate Family
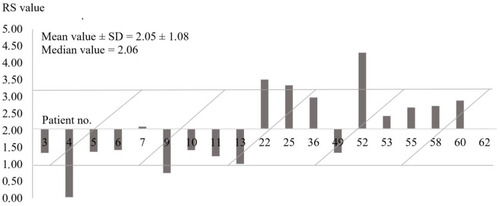
Figure 2 The individual radiosensitivity (RS) presented as the frequency of acentric fragments (Face(1)F) of each PCa patient. The RS value is calculated for each donor. The central cross-line (the x-axis) represents the mean RS value and how the RS value varies among the donors. The lines (above and below the x-axis) showed on the histogram are the standard deviation (±SD) of the mean RS value. The patient identification number is typed on a single bar.