Figures & data
Table 1 Primers of Col6a1 and Gapdh
Figure 1 The clone formation of AsPC-1 and BxPC-3 cancer cells cultured with the high or low level of glucose after 14 days. (A) Representative images of cell clone; (B) statistical analysis of clone counts. * P< 0.05.
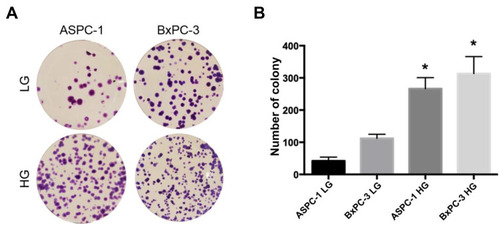
Figure 2 CCK-8 assay of AsPC-1 and BxPC-3 cancer cells cultured with the high or low level of glucose. (A) AsPC-1 cancer cell; (B) BxPC-3 cancer cell.
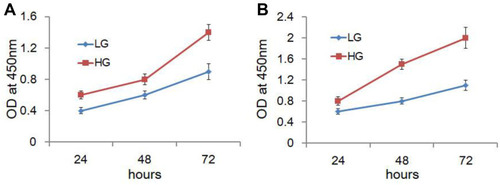
Figure 3 Migrated PC cancer cells treated with the low or high level of glucose in the Transwell assay. * P< 0.05.
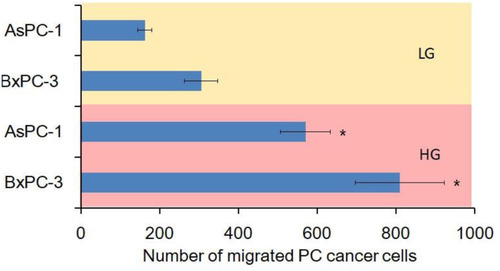
Figure 4 Expressions of Col6a1 gene and COL6A1 protein in PC cancer cells under different extracellular glucose levels. (A) Expressions of Col6a1 gene; (B) Expressions of COL6A1 protein. *P < 0.05.
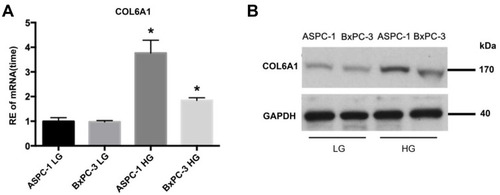
Table 2 The Level of COL6A1 Expression Between PC Patients without/with DM
Figure 5 Representative immunohistochemical images of low and high expression of COL6A1 in PC patient tissues. (A) Low expression of COL6A1 in PC without DM; (B) high expression of COL6A1 PC with DM.
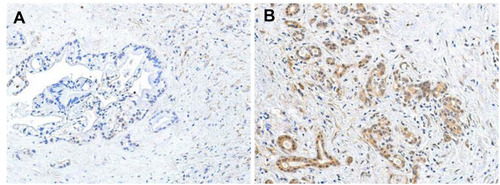
Table 3 The Clinic Characteristics of PC with DM and PC without DM
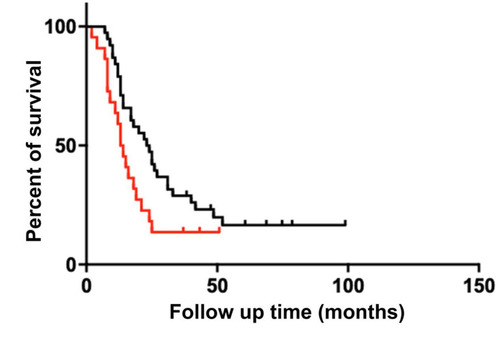
Figure 6 Kaplan–Meier curves of overall survival according to COL6A1 expression in PC patients with DM.