Figures & data

Figure 1 The Dose Volume Histogram of lung receiving a total radiotherapy dose of 60Gy. Blue line stands for the volume of lung receiving at different dose of radiotherapy; Yellow line stands for the volume of spinal cord at different dose of radiotherapy; Green line stands for the volume of heart at different dose of radiotherapy.
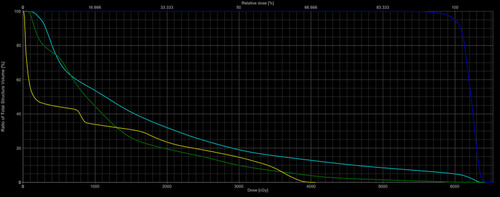
Figure 2 The treatment procedure. (A) Design of the preoperative plan, lines of different colors stand for different dose which was delivered to the primary tumor. (B) Course puncturing (C) The practical distribution of iodine −125 seed. (D) postoperative dose volume histography of tumor.
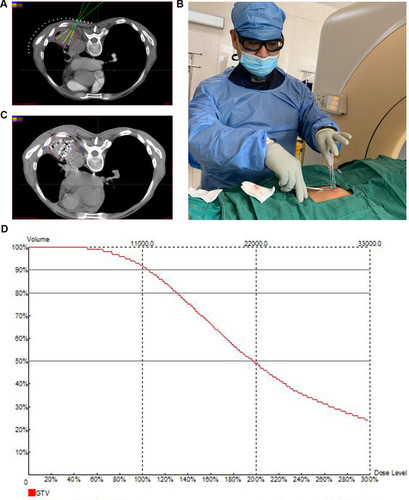
Table 1 General Information of All Patients
Table 2 CT Scan Measurement Showing the Efficacy of Combined-Modality Therapy in Locally Advanced NSCLC Invading the Chest Wall Among the Elderly
Table 3 Analysis of Cancer-Pain Relief
Table 4 Analysis of Physical Status Score
Table 5 Adverse Effects
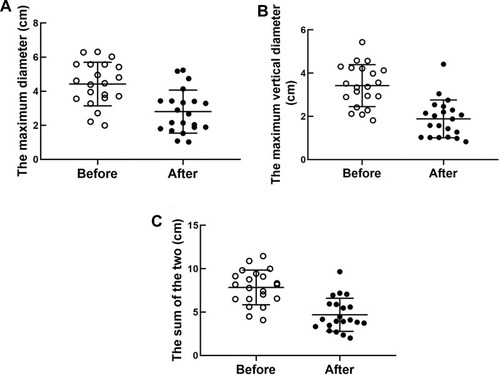
Figure 3 Efficacy of combined-therapy aiming at elderly patients with locally advanced NSCLC diagnosed as tumor invading the chest wall. (A) Compared with baseline, after six months combined-therapy, the maximum diameter of tumor showed a distinct decrease (4.42±1.28 vs 2.81±1.26cm) (P <0.001). (B) Compared with baseline, after six months combined-therapy, the maximum vertical diameter of tumor showed a distinct decrease (3.42±0.97 vs 1.89±0.87cm) (P <0.0001). (C) Compared with baseline, after six months combined-therapy, the sum of the two of tumor showed a distinct decrease (7.84±1.20 vs 4.69±1.90 cm) (P <0.0001).