Figures & data
Table 1 Primer Sequences for RT-qPCR
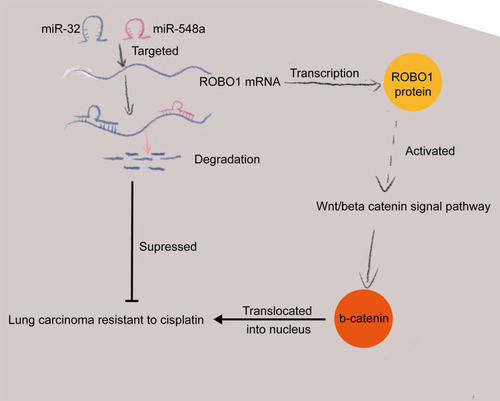
Figure 1 miR-32 and miR-548a are poorly expressed in DDP-resistant NSCLC cells. (A) Differentially expressed miRs in GSE56036 chip; (B) expression of miR-32 and miR-548a in tumor tissues of 36 patients with DDP-resistant NSCLC and 42 patients with DDP-sensitive NSCLC measured by RT-qPCR; (C) the predictive efficacies of miR-32 and miR-548a on DDP resistance in NSCLC patients testified by an ROC curve; (D) Kaplan Meier website predicted the expression of miR-32 and miR-548a and the life cycle of NSCLC patients; (E) IC50 values verified by CCK-8; (F) expression of miR-32 and miR-548a in parental or resistant A549 and H1299 cells examined by RT-qPCR. In Figures (E and F) each experiment was conducted three times; the data were described as mean ± SD and processed by two-way ANOVA and Tukey’s test, **p < 0.01, ***p < 0.001.
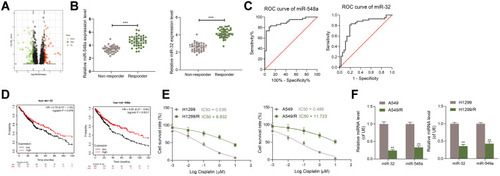
Figure 2 Overexpression of miR-32 and miR-548a enhances drug sensitivity of NSCLC cells to DDP. (A) RT-qPCR detected miR-32 and miR-548a expression in A549-R/H1299-R cells; (B) CCK-8 kit detected the IC50 value; (C) A549-R/H1299-R cells overexpressing miR-32 and miR-548a were exposed to 10 μM DDP for 12 h, and then cells were used for colony formation assay; (D) the number and proportion of EdU-positive cells examined by EdU staining; (E) apoptosis rate identified by flow cytometry; (F) The LDH content detected by a LDH kit. Each experiment was conducted three times, and the data were described as mean ± SD and processed by two-way ANOVA and Tukey’s test, **p < 0.01.
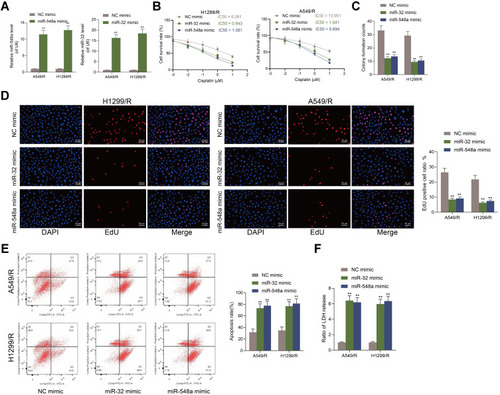
Figure 3 miR-32 and miR-548a target ROBO1. (A–B) Differentially expressed genes in GSE21656 chip; (C) targeted mRNAs of miR-32 and miR-548a predicted on StarBase and miRDB bioinformatic systems, and the results were cross screened with the upregulated genes in GSE21656 chip; (D) ROBO1 expression in DDP-resistant and sensitive tissues examined by RT-qPCR; (E) RT-qPCR detected ROBO1 in parental and drug-resistant cells; (F–G) dual-luciferase assay verified the targeting relationships between miR-32/miR-548a and ROBO1. In Figures (E and G) each experiment was performed three times; the data were described as mean ± SD and processed by two-way ANOVA and Tukey’s test, **p < 0.01, ***p < 0.001.
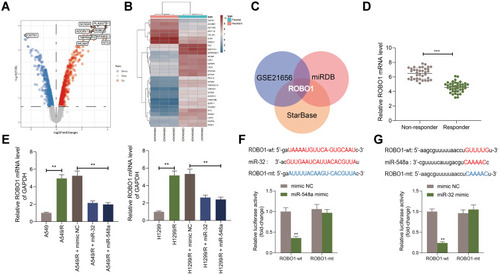
Figure 4 Overexpression of ROBO1 blocks the effects of miR-32 and miR-548a mimic on DDP sensitivity. (A) RT-qPCR detected ROBO1 expression in A549-R/H1299-R cells; (B) CCK-8 kit detected the IC50 value; (C) A549-R/H1299-R cells overexpressing ROBO1 were exposed to 10 μM DDP for 12 h, and the number and proportion of EdU-positive cells examined by EdU staining; (D) the apoptosis rate identified by flow cytometry; (E) the LDH content detected by a LDH kit. Each experiment was done three times, and the data were exhibited as mean ± SD and processed by two-way ANOVA and Tukey’s test; **p < 0.01 vs miR-32 + oe- NC; ##p < 0.01 vs miR-548a + oe-NC.
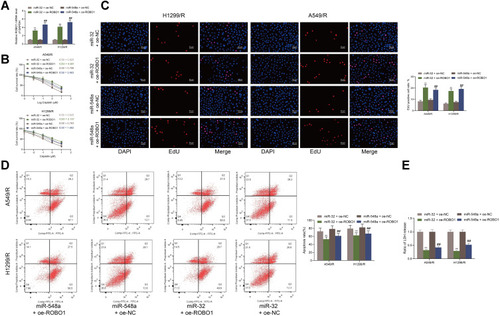
Figure 5 ROBO1 promotes DDP resistance by activating the Wnt/β-catenin axis. (A–B) RT-qPCR examined expression of Wnt1, β-catenin and CCND1; (C) nuclear translocation of β-catenin in cells detected by immunofluorescence; (D) the percentage of TCF/LEF luciferase activity was shown as the percentage of relative light units of fire luciferase to Renilla luciferase. Each experiment was done three times, and the data were exhibited as mean ± SD and processed by two-way ANOVA and Tukey’s test; **p < 0.01.
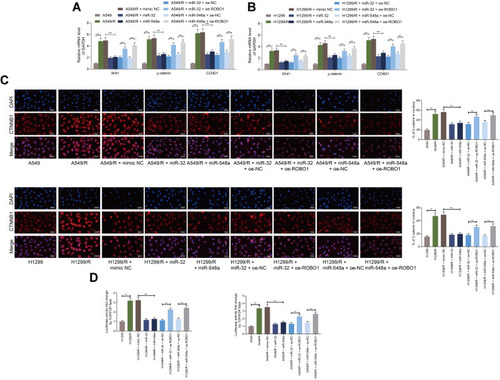
Figure 6 Overexpression of miR-32 and miR-548a inhibits DDP resistance in vivo. (A) The growth curve of xenograft tumor formed by A549-R cells (the arrows indicate the time points for DDP administration in mice after cell injection); (B) photos of mice and tumors and weight of the xenograft tumors; (C–E) the staining intensity of Ki67, CTNNB1 and ROBO1 in xenograft tumor was detected by immunohistochemistry; (F) the proportion of apoptotic cells in xenograft tumor detected by TUNEL. N = 5 in each group. The data were exhibited as mean ± SD and processed by two-way ANOVA and Tukey’s test; **p < 0.01, ***p < 0.001.
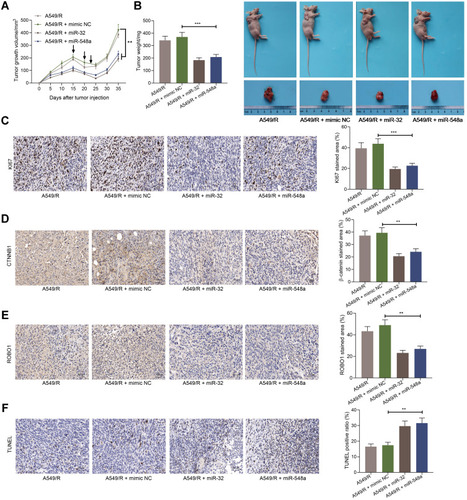
Figure 7 A diagram for the molecular mechanism. miR-32 and miR-548a negatively regulate ROBO1 in NSCLC cells and inhibit Wnt/β-catenin activation, thus promoting the sensitivity of NSCLC cells to DDP.