Figures & data
Table 1 Patient characteristics
Table 2 Univariate and multivariate logistic regression model for risk factors of AL
Figure 1 Forest plot.
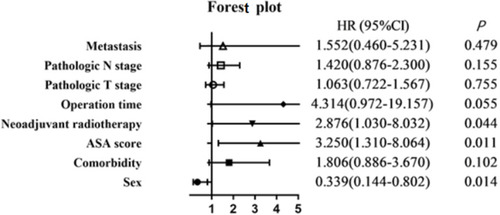
Figure 2 Nomogram for predicting anastomotic leakage (C index 0.645) after rectal cancer surgery. Incidence of anastomotic leakage was estimated by summing scores of sex, ASA score, and neoadjuvant radiotherapy.
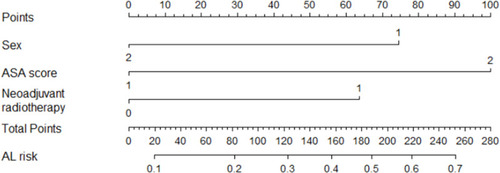
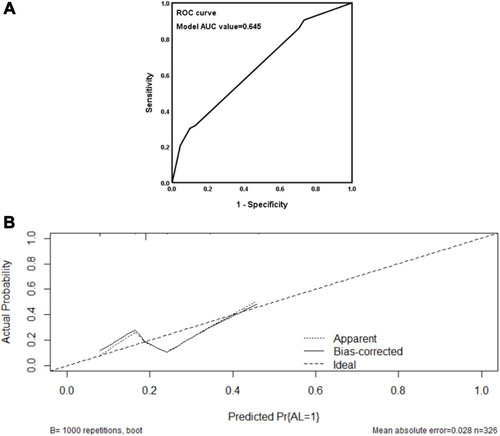
Figure 3 (A) ROC curve for the nomogram. AUC was 0.645 (95% CI 0.762–0.903). (B) Nomogram calibration curve. The y‐axis represents the actual probability of anastomotic leakage. The x‐axis represents predicted anastomotic leakage probability. The ideal line represents a perfect prediction model. The apparent line represents the performance of the nomogram, and a close fit to the ideal line represents a good prediction.