Figures & data
Figure 1 High level of circPRDM2 in DXR-resistant OS tissues and cells. (A and B) The expression of circPRDM2 in OS tissues, normal tissues, OS cells (KHOS and MG63) and normal cells (hFOB1.19) was determined by qRT-PCR assay. (C) The expression of circPRDM2 in DXR-resistant and DXR-sensitive OS tissues was examined by qRT-PCR assay. (D) The expression of circPRDM2 in KHOS, KHOS/DXR, MG63 and MG63/DXR cells was detected by qRT-PCR assay. (E and F) The levels of circPRDM2 and GAPDH in KHOS/DXR and MG63/DXR cells treated with or without RNase R were determined by qRT-PCR assay. *P<0.05.
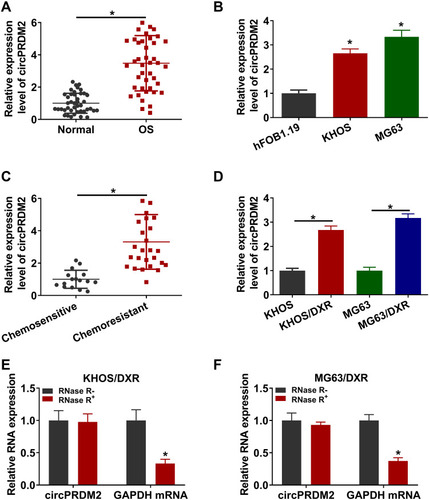
Figure 2 CircPRDM2 silencing repressed DXR resistance in DXR-resistant OS cells. KHOS/DXR and MG63/DXR cells were transfected with si-NC, si-circPRDM2#1 or si-circPRDM2#2. (A) The expression of circPRDM2 in KHOS/DXR and MG63/DXR cells was detected by qRT-PCR assay. (B) IC50 of DXR in KHOS/DXR and MG63/DXR cells was examined by CCK-8 assay. (C) The colony formation ability of KHOS/DXR and MG63/DXR cells was assessed by colony formation assay. (D–F) The migration and invasion of KHOS/DXR and MG63/DXR cells were evaluated by wound-healing assay and transwell assay. (G) The apoptosis of KHOS/DXR and MG63/DXR cells was analyzed by flow cytometry analysis. (H and I) The protein levels of MRP1, P-gp and LRP in KHOS/DXR and MG63/DXR cells were measured by Western blot assay. *P<0.05.
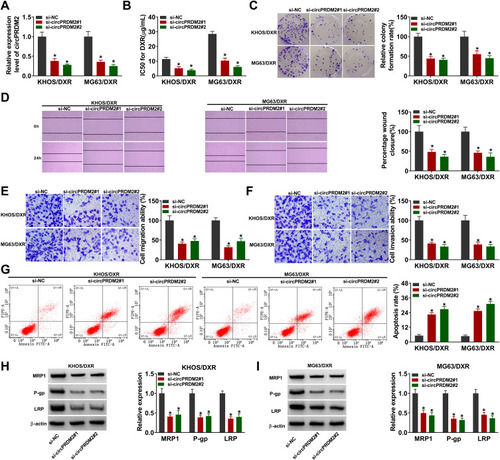
Figure 3 MiR-760 was targeted by circPRDM2. (A) The binding sites between circPRDM2 and miR-760. (B) The expression of miR-760 in KHOS/DXR and MG63/DXR cells transfected with miR-NC, miR-760, in-miR-NC or in-miR-760 was detected by qRT-PCR assay. (C and D) The luciferase activity in KHOS/DXR and MG63/DXR cells co-transfected with miR-NC/miR-760 and circPRDM2 WT/circPRDM2 MUT was measured. (E and F) After RIP assay, the enrichment of miR-760 and circPRDM2 in the samples bound to Anti-AGO2 or Anti-IgG was detected by qRT-PCR assay. (G and H) The expression of miR-760 pulled down by Bio-NC, Bio-circPRDM2 WT or Bio-circPRDM2 MUT was detected by qRT-PCR assay. (I) The expression of miR-760 in chemoresistant and chemosensitive OS tissues was determined by qRT-PCR assay. (J) The level of miR-760 in KHOS, MG63, KHOS/DXR and MG63/DXR cells was determined with qRT-PCR assay. (K) After KHOS/DXR and MG63/DXR cells were transfected with si-NC, si-circPRDM2#2, si-circPRDM2#2+in-miR-NC or si-circPRDM2#2+in-miR-760, the level of miR-760 was examined by qRT-PCR assay. *P<0.05.
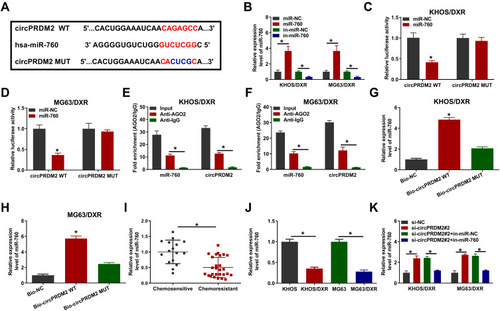
Figure 4 CircPRDM2 silencing improved DXR sensitivity in DXR-resistant OS cells by targeting miR-760. KHOS/DXR and MG63/DXR cells were transfected with si-NC, si-circPRDM2#2, si-circPRDM2#2+in-miR-NC or si-circPRDM2#2+in-miR-760. (A) IC50 of DXR in KHOS/DXR and MG63/DXR cells was assessed by CCK-8 assay. (B) The colony formation capacity of KHOS/DXR and MG63/DXR cells was tested by colony formation assay. (C–E) The migration and invasion of KHOS/DXR and MG63/DXR cells were investigated by wound-healing assay and transwell assay. (F) The apoptosis of KHOS/DXR and MG63/DXR cells was analyzed by flow cytometry analysis. (G and H) The protein levels of MRP1, P-gp and LRP in KHOS/DXR and MG63/DXR cells were measured by Western blot assay. *P<0.05.
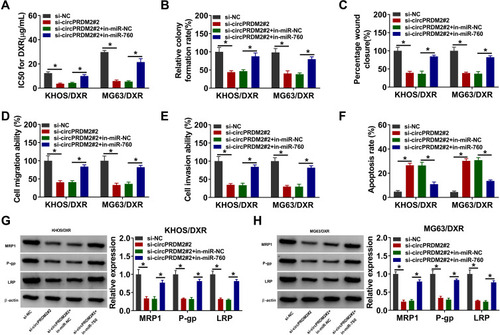
Figure 5 CircPRDM2 sequestered miR-760 to regulate EZH2 expression. (A) The complementary sequences between miR-760 and EZH2 were exhibited. (B–E) The interaction between miR-760 and EZH2 was demonstrated by dual-luciferase reporter assay and RNA pull-down assay. (F and G) The mRNA and protein levels of EZH2 in chemoresistant and chemosensitive OS tissues were measured by qRT-PCR assay and Western blot assay, respectively. (H) The protein level of EZH2 in KHOS, MG63, KHOS/DXR and MG63/DXR cells was measured by Western blot assay. (I) The protein level of EZH2 in KHOS/DXR and MG63/DXR cells transfected with miR-NC, miR-760, miR-760+pcDNA or miR-760+EZH2 was measured by Western blot assay. (J) The protein level of EZH2 in KHOS/DXR and MG63/DXR cells transfected with si-NC, si-circPRDM2#2, si-circPRDM2#2+in-miR-NC or si-circPRDM2#2+in-miR-760 was measured by Western blot assay. *P<0.05.
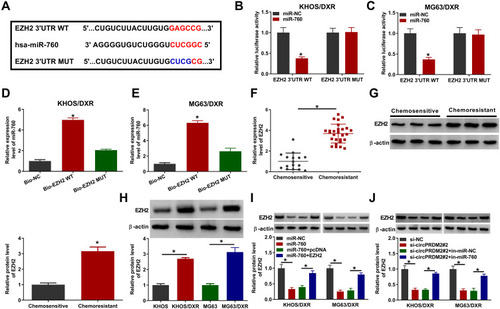
Figure 6 MiR-760 overexpression repressed DXR resistance in DXR-resistant OS cells by binding to EZH2. KHOS/DXR and MG63/DXR cells were transfected with miR-NC, miR-760, miR-760+pcDNA or miR-760+EZH2. (A) IC50 of DXR in KHOS/DXR and MG63/DXR cells was assessed by CCK-8 assay. (B) The colony formation of KHOS/DXR and MG63/DXR cells was investigated by colony formation assay. (C–E) The migration and invasion of KHOS/DXR and MG63/DXR cells were assessed by wound-healing assay and transwell assay. (F) The apoptosis of KHOS/DXR and MG63/DXR cells was analyzed by flow cytometry analysis. (G and H) The protein levels of MRP1, P-gp and LRP in c were measured via Western blot assay. *P<0.05.
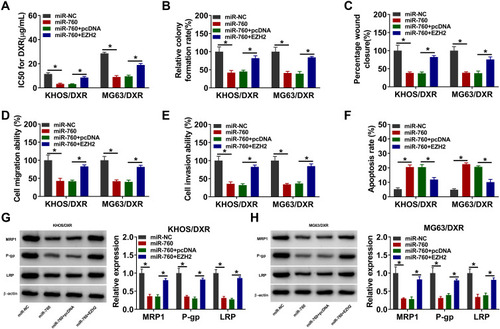
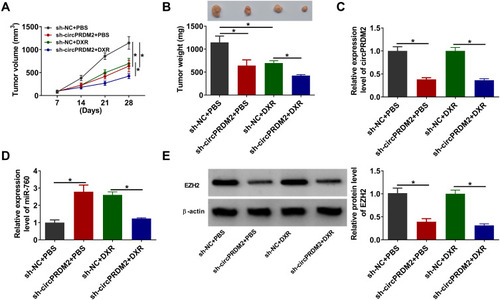
Figure 7 CircPRDM2 knockdown suppressed DXR resistance in vivo. (A) Tumor volume was monitored every week. (B) Tumor weight was examined on day 28. (C and D) The levels of circPRDM2 and miR-760 in xenografted tumors were determined by qRT-PCR assay. (E) The protein level of EZH2 in xenografted tumors was detected by Western blot assay. *P<0.05.