Figures & data
Figure 1 Circ_0020123 was upregulated in NSCLC tissues and cells. (A) The expression of circ_0020123 in NSCLC tumor tissues (Tumor, n = 30) and normal non-cancerous tissues (Normal, n = 30) was detected by qRT-PCR. (B) QRT-PCR was used to determine the expression of circ_0020123 in NSCLC cells (H1299, H1581 and A549) and 16HBE cells. ***P < 0.001.
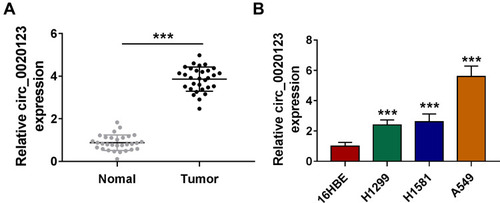
Figure 2 Interference of circ_0020123 suppressed NSCLC progression. (A) The transfection efficiencies of si-circ_0020123#1, si-circ_0020123#2 and si-circ_0020123#3 were confirmed by detecting circ_0020123 expression using qRT-PCR in H1299 and A549 cells. (B–H) H1299 and A549 cells were transfected with si-NC, si-circ_0020123#1 or si-circ_0020123#2. CCK8 assay (B), colony formation assay (C), flow cytometry (D) and transwell assay (E and F) were used to measure the viability, the number of cloned cells, apoptosis rate, the numbers of migrated and invaded cells. (G and H) WB analysis was used to detect the protein levels of Cyclin D1, Bax and MMP-9. **P < 0.01, ***P < 0.001.
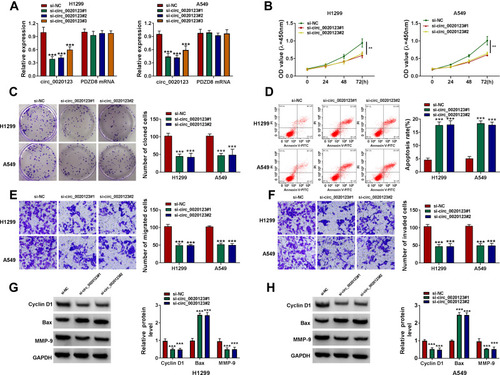
Figure 3 MiR-142-3p could be sponged by circ_0020123. (A) The binding sites and the constructed mutate sites of circ_0020123 in miR-142-3p were shown. Dual-luciferase reporter assay (B) and RIP assay (C) were used to confirm the interaction between circ_0020123 and miR-142-3p. (D) QRT-PCR was used to measure miR-142-3p expression in NSCLC tumor tissues (Tumor, n = 30) and normal non-cancerous tissues (Normal, n = 30). (E) The expression of miR-142-3p in NSCLC cells (H1299, H1581 and A549) and 16HBE cells was detected using qRT-PCR. (F) MiR-142-3p expression was examined by qRT-PCR in H1299 and A549 cells transfected with si-NC, si-circ_0020123#1 or si-circ_0020123#2. (G) Pearson correlation analysis was performed to measure the correlation between circ_0020123 and miR-142-3p in NSCLC tumor tissues. **P < 0.01, ***P < 0.001.
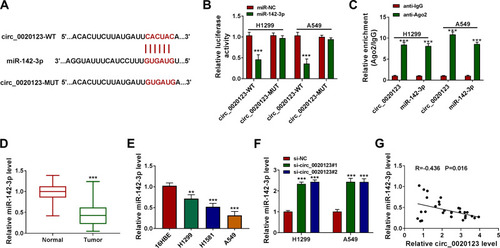
Figure 4 MiR-142-3p inhibitor reversed the regulation of circ_0020123 silencing on NSCLC progression. (A) QRT-PCR was used to examine the expression of miR-142-3p to assess the transfection efficiencies of miR-142-3p mimic and inhibitor in H1299 and A549 cells. (B–H) H1299 and A549 cells were transfected with si-NC, si-circ_0020123#1, si-circ_0020123#1 + in-miR-NC, or si-circ_0020123#1 + in-miR-142-3p. (B) The expression of miR-142-3p was detected by qRT-PCR. The viability, the number of cloned cells, apoptosis rate, the numbers of migrated and invaded cells were determined using CCK8 assay (C), colony formation assay (D), flow cytometry (E) and transwell assay (F and G). (H and I) The protein levels of Cyclin D1, Bax and MMP-9 were measured using WB analysis. **P < 0.01, ***P < 0.001.
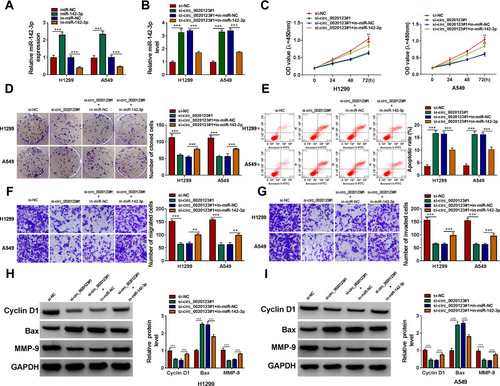
Figure 5 ZFX was a target of miR-142-3p. (A) The sequences of WT-ZFX 3ʹUTR and MUT-ZFX 3ʹUTR were presented. (B) The interaction between ZFX and miR-142-3p was verified using dual-luciferase reporter assay. (C) The ZFX mRNA level in NSCLC tumor tissues (Tumor, n = 30) and normal non-cancerous tissues (Normal, n = 30) was detected by qRT-PCR. (D) WB analysis was used to measure the protein level of ZFX in NSCLC cells (H1299, H1581 and A549) and 16HBE cells. (E) After transfected with miR-NC, miR-142-3p, in-miR-NC or in-miR-142-3p into H1299 and A549 cells, the ZFX protein level was determined by WB analysis. (F) The correlation between miR-142-3p and ZFX in NSCLC tumor tissues was evaluated using Pearson correlation analysis. ***P < 0.001.
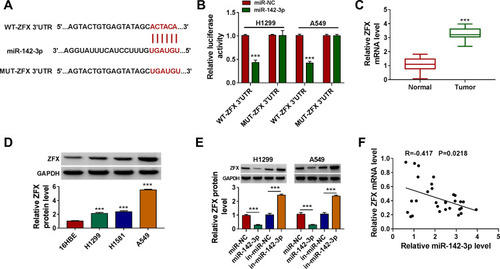
Figure 6 ZFX silencing inhibited NSCLC proliferation and metastasis. (A) The transfection efficiencies of si-ZFX#1, si-ZFX#2 and si-ZFX#3 were confirmed by detecting ZFX mRNA and protein expression in H1299 and A549 cells using qRT-PCR and WB analysis. (B–H) H1299 and A549 cells were transfected with si-NC, si-ZFX#1 or si-ZFX#2. CCK8 assay (B), colony formation assay (C), flow cytometry (D) and transwell assay (E and F) were employed to examine the viability, the number of cloned cells, apoptosis rate, the numbers of migrated and invaded cells. (G and H) The protein levels of Cyclin D1, Bax and MMP-9 were assessed by WB analysis. ***P < 0.001.
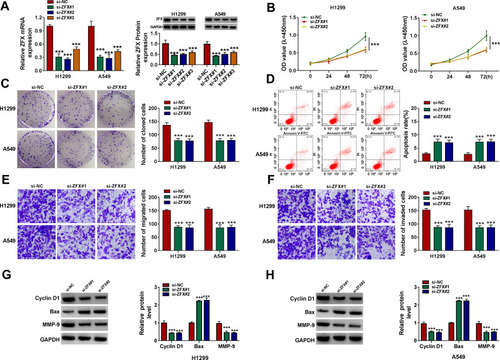
Figure 7 The promotion effect of miR-142-3p inhibitor on NSCLC progression could be reversed by ZFX knockdown. H1299 and A549 cells were transfected with in-miR-NC, in-miR-142-3p, in-miR-142-3p + si-NC or in-miR-142-3p + si-ZFX#1. (A) The mRNA and protein expression of ZFX was measured by qRT-PCR and WB analysis. The viability, the number of cloned cells, apoptosis rate, the numbers of migrated and invaded cells were evaluated by CCK8 assay (B), colony formation assay (C), flow cytometry (D) and transwell assay (E and F). (G and H) WB analysis was employed to detect the protein levels of Cyclin D1, Bax and MMP-9. **P < 0.01, ***P < 0.001.
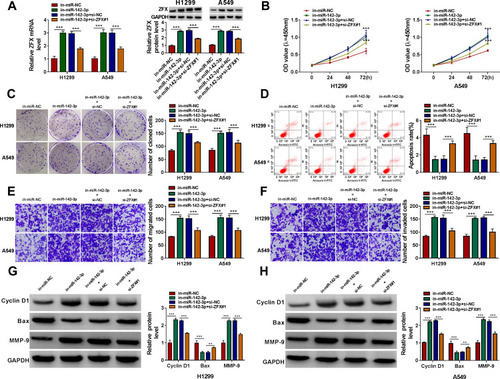
Figure 8 Circ_0020123 regulated ZFX by sponging miR-142-3p. H1299 and A549 cells were transfected with si-NC, si-circ_0020123#1, si-circ_0020123#1 + in-miR-NC, or si-circ_0020123#1 + in-miR-142-3p. QRT-PCR (A and B) and WB analysis (C and D) were used to determine the mRNA and protein expression levels of ZFX in H1299 cells and A549 cells. *P < 0.05, **P < 0.01, ***P < 0.001.
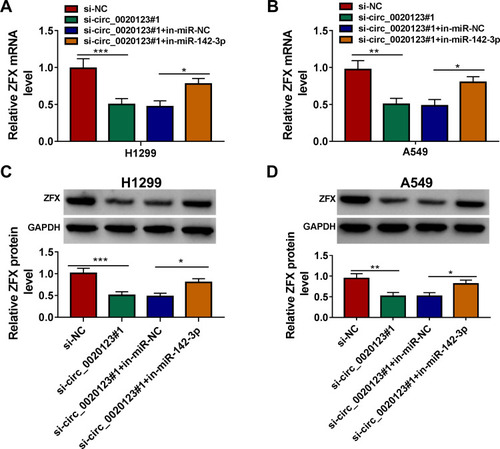
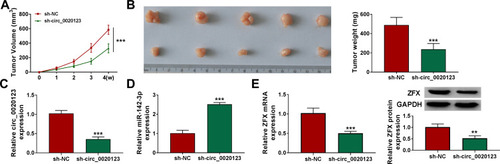
Figure 9 Knockdown of circ_0020123 could hinder NSCLC tumorigenesis in vivo. H1299 cells transfected with sh-NC or sh-circ_0020123 were injected into nude mice. (A) Tumor volume was measured every week. (B) After 4 weeks, the tumor was collected, photographed and weighted. (C and D) The expression of circ_0020123 and miR-142-3p was detected by qRT-PCR. (E) The mRNA and protein expression of ZFX in the tumors of mice was assessed using qRT-PCR and WB analysis. **P < 0.01, ***P < 0.001.