
Figures & data
Table 1 Clinical Characteristics of Patients
Table 2 Relationship Between Patient Characteristics and ALI
Figure 1 Receiver operating characteristic (ROC) curves. (A) shows the ROC curve of advanced lung cancer inflammation index (ALI). The maximum Youden index is 0.094, corresponding optimal cutoff value of ALI is 48.2. (B) shows the ROC curves of red blood cell count (RBC), white blood cell count (WBC), platelet count (PLT), monocyte count (MONO), eosinophil count (EO), basophil count (BASO), lymphocyte to monocyte ratio (LMR), platelet to lymphocyte ratio (PLR), neutrophil to lymphocyte ratio (NLR) and serum albumin (ALB). Maximum Youden indexes are as follows: 0.375 for RBC, 0.531 for WBC, 0.094 for PLT, 0.500 for MONO, 0.313 for EO, 0.438 for BASO, 0.063 for LMR, 0.063 for PLR, 0.125 for NLR and 0.250 for ALB. Optimal cutoff points of RBC (×1012/L), WBC (×109/L), PLT (×109/L), MONO (×109/L), EO (×109/L), BASO (×109/L), LMR, PLR, NLR and ALB (g/dL) are 4.30, 6.47, 231.50, 0.38, 0.12, 0.45, 10.86, 124.27, 2.08 and 4.13.
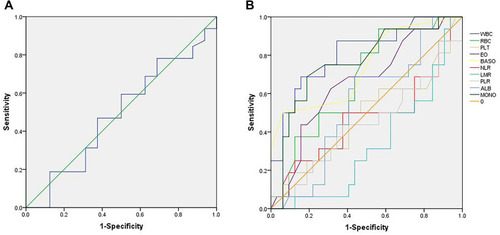
Figure 2 Patient overall survival (OS) curves following surgery. The curves indicate that high ALI group (ALI≥48.2) shows more survival rates and longer survival time (P<0.05).
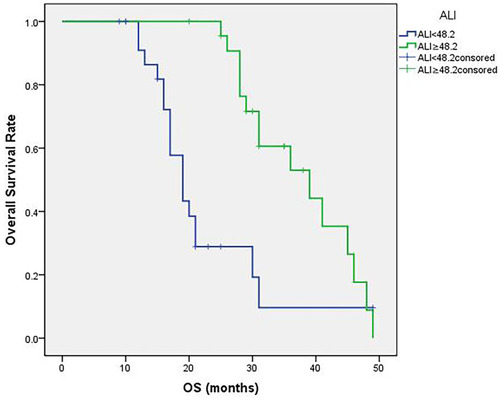
Table 3 Univariable and Multivariable Analysis