Figures & data
Table 1 Multivariable Logistic Regression Analysis of Characteristics of Patients with Hepatocellular Carcinoma Presenting with Pulmonary Metastasis at the Initial Diagnosis (%)
Table 2 Comparison of Characteristics of the Primary and Validation Sets (%)
Table 3 Univariate and Multivariate Analysis of Overall Survival for the Primary Set
Figure 1 Nomogram for predicting the overall survival of patients with hepatocellular carcinoma (HCC) presenting with pulmonary metastasis.
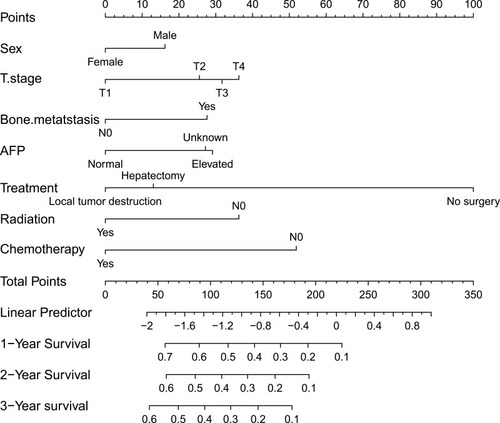
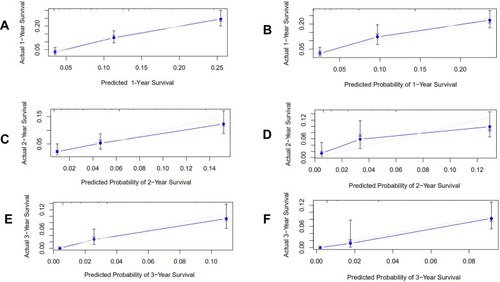
Figure 2 Calibration curves for the nomograms. The nomograms predicted the 1- (A for the primary cohort, B for the validation cohort), 2-year (C for the primary cohort, D for the validation cohort) and 3-year (E for the primary cohort, F for the validation cohort) overall survival of patients with hepatocellular carcinoma (HCC) presenting with pulmonary metastasis.