Figures & data
Figure 1 (A) showed the VOI of tumor. (B) was the VOI of mini-peritumor, which automatically expanded 2-mm from the margin of the lesion with “A.K.” software. (C and D) was the manually divided Pr/Pf-VOI based on the mini-peritumoral VOI. (E) demonstrated that the Pr-VOI did not include blood vessels and fat in renal hilar region. (F) illustrated that if the Pf-VOI affected by the surrounding structures (such as intestine, liver, adjacent muscle, and so on), this portion was manually removed.
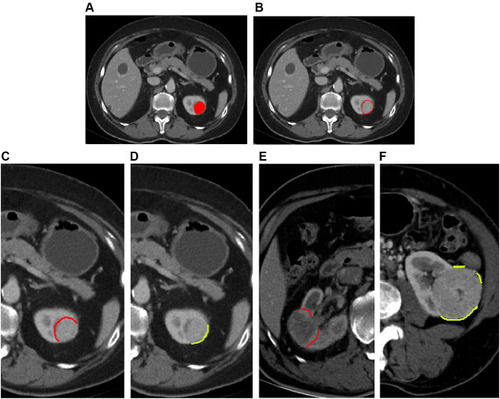
Figure 2 The program flowchart of CT-based radiomics analysis.
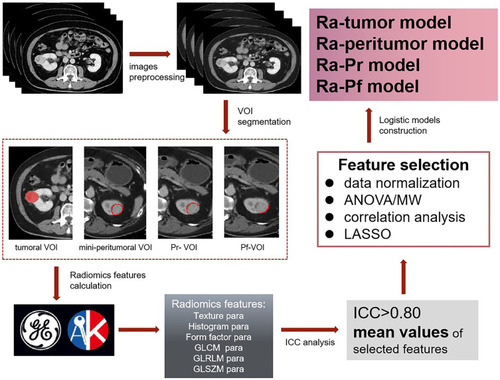
Table 1 Patients’ General Characteristics
Figure 3 The ROC curves of mini-peritumoral radiomics models of CMP and NP. The AUCs of NP were higher than those of CMP in both the training (A) and validation (B) sets.
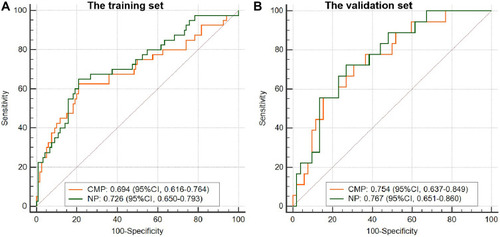
Table 2 The AUCs of Tumoral and Mini-Peritumoral Radiomics Models in NP
Figure 4 The heat map of Ra-Pr to distinguish fp-AML from ccRCC. There were five optimal radiomics features left in Ra-Pr. And zero presented the ccRCC, one presented the fp-AML.
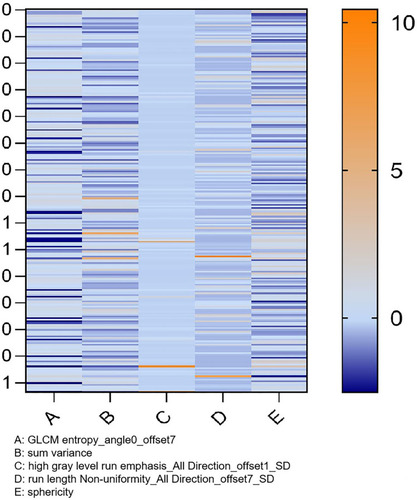
Table 3 The Cohort of Ra-Tumor, Ra-Peritumor, and Ra-tumor+Pr Models
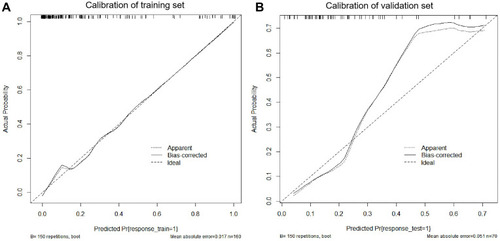
Figure 5 The calibration curves of training and validation set of Ra-tumor+Pr (A and B).