Figures & data
Table 1 Associations of TIPE Expression with Various Clinicopathological Factors of Colon Cancer Patients
Table 2 Associations of TIPE Expression with Various Clinicopathological Factors of Right-Sided and Left-Sided Colon Cancer Patients
Figure 1 The expression of TIPE in different samples. (A) Representative immunohistochemical staining showed low TIPE expression in left-side adjacent normal tissue. (B) Representative immunohistochemical staining showed low TIPE expression in right-side adjacent normal tissue. (C) Expression of TIPE in tumor tissues without lymphatic invasion. (D) Representative immunohistochemical staining showed high TIPE expression in left-side colon cancer. (E) Representative immunohistochemical staining showed high TIPE expression in right-side colon cancer. (F) Expression of TIPE in tumor tissues with lymphatic invasion. (G) Before–after plot showing the immunoreactive score (IRS) of paired tumor tissue and adjacent normal tissue for TIPE. (H) The IRS of TIPE expression in LCC and RCC. (I) IRS of TIPE expression in colon cancer specimens with or without lymph node metastasis. *P<0.01; **P<0.0001.
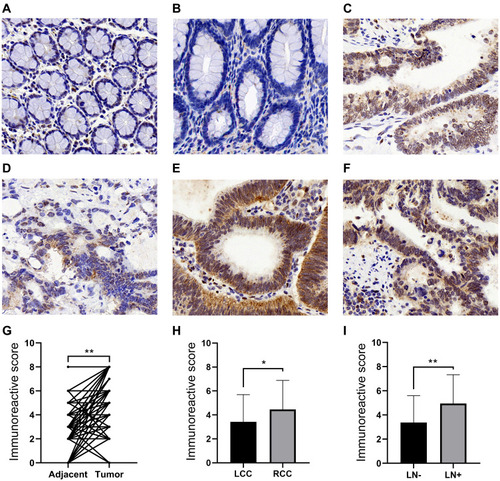
Table 3 ROC-Related Parameters for Predicting 5-Year Overall Survival
Table 4 ROC-Related Parameters for Predicting Lymph Node Metastasis
Figure 2 ROC curves of the prediction index value in predicting five-year overall survival of patients with (A) colon cancer; (B) right-sided colon cancer; (C) left-sided colon cancer. ROC curves of the prediction index value in predicting lymph node metastasis of patients with (D) colon cancer; (E) right-sided colon cancer; (F) left-sided colon cancer.
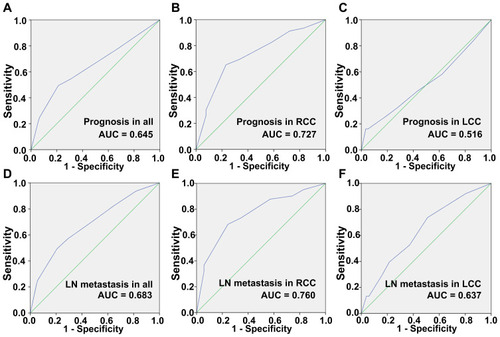
Table 5 Prognostic Value of TIPE Expression and Clinicopathological Factors for the Overall Survival of Colon Cancer Patients by Univariate and Multivariate Analyses with Cox Regression
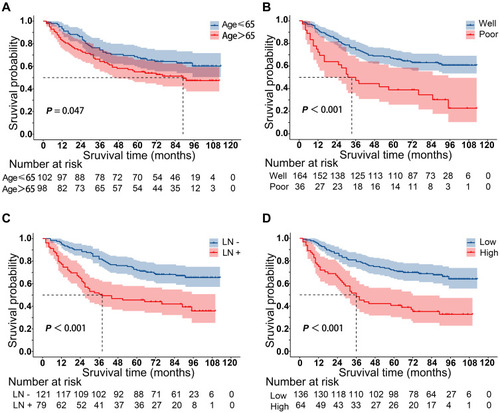
Figure 3 Kaplan–Meier curves for overall survival according to the (A) age; (B) differentiation; (C) lymph node metastasis; (D) TIPE expression level.