Figures & data
Table 1 Basic Characteristics of Patients
Table 2 Sequences for Transfection
Table 3 Primers for RT-qPCR
Figure 1 EZH2 was upregulated in HCC, which was associated with poor prognosis of patients. (A) Data on EZH2 expression in LIHC were collected from GEPIA 2 (http://gepia2.cancer-pku.cn/#analysis). (B) Survival probability of patients with HCC was predicted using Kaplan-Meier Plotter (http://kmplot.com/analysis/index.php). (C) Relative EZH2 expression in HCC and Normal tissue was measured via RT-qPCR. GAPDH was used as internal control. (D) Relative EZH2 expression in HCC cells (SNU-182, SNU-387, SNU-423, and PLC/PRF/5) and liver epithelial cell line THLE-2 was quantified via RT-qPCR. GAPDH was used as internal control. All experiments have been performed in triplicate and data were expressed as mean ± standard deviation (SD). (A) *P<0.001, vs Non-LIHC (N); (D) ***P<0.001, vs.
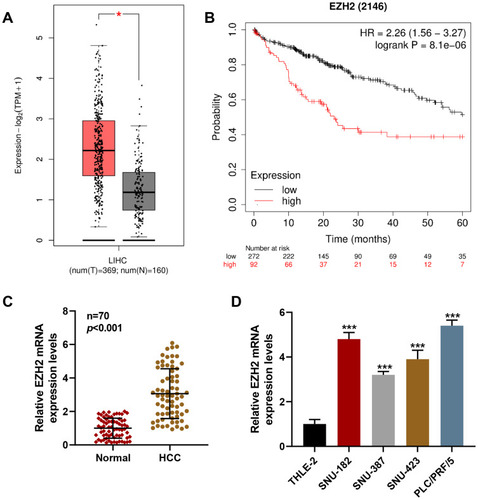
Figure 2 Silencing EZH2 suppressed EZH2 expression and HCC cell viability and migration, whereas EZH2 overexpression did conversely. (A) Relative EZH2 mRNA expression following shEZH2 or EZH2 overexpression plasmid transfection in HCC cell was calculated via RT-qPCR. GAPDH was chosen as internal reference. (B and C) Relative EZH2 protein expression following shEZH2 or EZH2 overexpression plasmid transfection in HCC cell was calculated via Western blot. GAPDH was chosen as internal reference. (D) MTT assay was used to determine the viability of HCC cells following shEZH2 or EZH2 overexpression plasmid transfection at 0, 24 and 48 hours. (E and F) Scratch assay were used to detect the migration of HCC cells at 0 and 24 hours following shEZH2 or EZH2 overexpression plasmid transfection. Magnification: × 100. All experiments have been performed in independent triplicate and data were expressed as mean ± standard deviation (SD). ^P<0.05, ^^P<0.01, ^^^P<0.001, vs Vector.
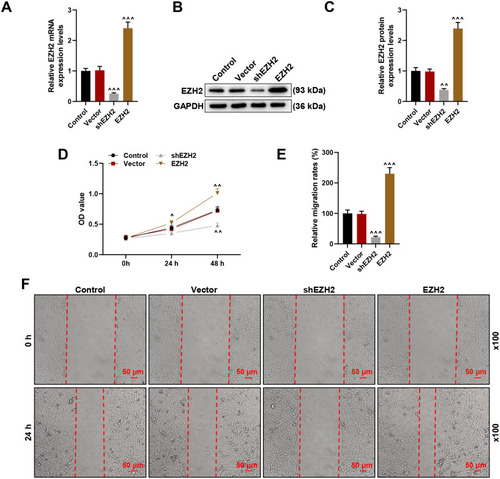
Figure 3 Silencing EZH2 suppressed HCC cell invasion and regulated and epithelial-to-mesenchymal transition (EMT)-related markers’ expression, whereas EZH2 overexpression did oppositely. (A and B) Transwell assay were used to detect the invasion of HCC cells at 24 hours following shEZH2 or EZH2 overexpression plasmid transfection. Magnification: × 250. (C) Relative mRNA expression of EMT-related factors (N-Cadherin, Vimentin and E-Cadherin) in HCC cells following shEZH2 or EZH2 overexpression plasmid transfection was quantified using RT-qPCR. GAPDH was used as internal reference. (D and E) Relative mRNA expression of EMT-related factors (N-Cadherin, Vimentin and E-Cadherin) in HCC cells following shEZH2 or EZH2 overexpression plasmid transfection was quantified using RT-qPCR. GAPDH was used as internal reference. All experiments have been performed in independent triplicate and data were expressed as mean ± standard deviation (SD). ^^P<0.01, ^^^P<0.001, vs Vector.
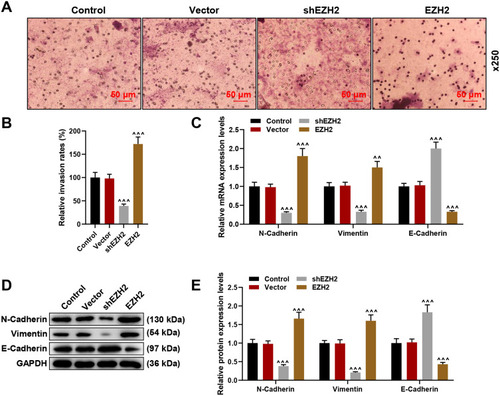
Figure 4 Silencing EZH2 reversed the effects of TGF-β1 on HCC cell viability and migration. (A) MTT assay was used to determine the viability of HCC cells following shEZH2 transfection and TGF-β1 at 0, 24 and 48 hours. (B and C) Scratch assay were used to detect the migration of HCC cells at 0 and 24 hours following shEZH2 or EZH2 overexpression plasmid transfection. Magnification: × 100. All experiments have been performed in independent triplicate and data were expressed as mean ± standard deviation (SD). *P<0.05, ***P<0.001, vs Control; ^P<0.05, ^^P<0.01, ^^^P<0.001, vs TGF-β1+Vector.

Figure 5 Silencing EZH2 reversed the effects of TGF-β1 on HCC cell invasion and epithelial-to-mesenchymal transition (EMT)-related markers’ expression. (A and B) Transwell assay was used to detect invasion at 24 hours of HCC cells following shEZH2 transfection and TGF-β1. Magnification: × 250. (C) Relative mRNA expression of migration- and invasion-related factors (N-Cadherin, Vimentin and E-Cadherin) in HCC cells following shEZH2 transfection and TGF-β1 was quantified using RT-qPCR. GAPDH was used as internal reference. (D and E) Relative mRNA expression of EMT-related factors (N-Cadherin, Vimentin and E-Cadherin) in HCC cells following shEZH2 transfection and TGF-β1 transfection was quantified using RT-qPCR. GAPDH was used as internal reference. All experiments have been performed in independent triplicate and data were expressed as mean ± standard deviation (SD). *P<0.05, **P<0.01, ***P<0.001, vs Control; ^^^P<0.001, vs TGF-β1+Vector.
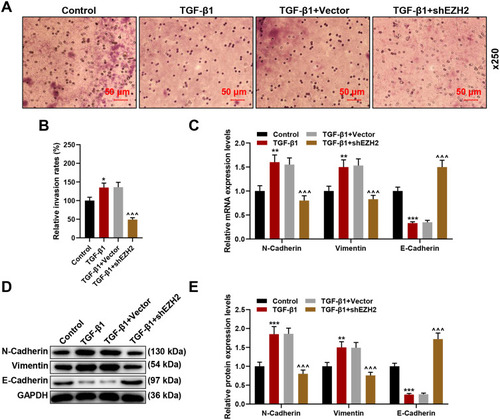
Figure 6 Silencing EZH2 solely reversed effects of TGF-β1 on EZH2 expression in TGF-β-MTA1-SMAD7-SMAD3-SOX4-EZH2 signaling axis in HCC cells. (A–C) Relative expressions of TGF-β-MTA1-SMAD7-SMAD3-SOX4-EZH2 signaling axis-related proteins were measured via Western blot, and ratios of p-SMAD3/SMAD3 were determined as well. GAPDH was used as internal control. All experiments have been performed in independent triplicate and data were expressed as mean ± standard deviation (SD). **P<0.01, ***P<0.001, vs Control; ^^^P<0.001, vs TGF-β1+Vector.
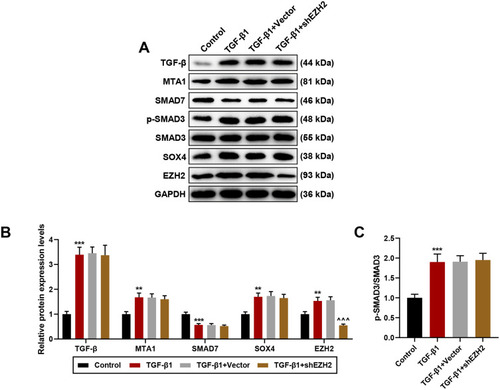
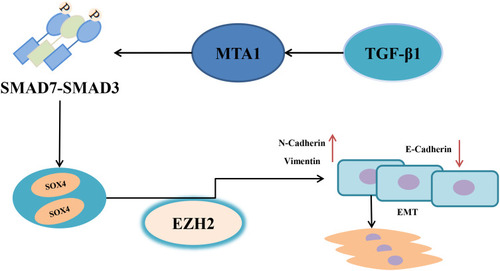
Figure 7 Schematic diagram showing the TGF-β-MTA1-SMAD7-SMAD3-SOX4-EZH2 signaling axis in promoting EMT in HCC cells.