Figures & data
Figure 1 Clinical expression of GAS5 in CCA patients. (A) The expression profile of GAS5 by bioinformatics analysis according to the GEPIA database. (B) Differential expression of GAS5 between CCA and healthy tissues based on the GEPIA database. *p<0.05. (C) Differential expression of GAS5 in stage I, stage II and stage IV of CCA. (D) qRT-PCR was applied to detect the differential expression of GAS5 in CCA tissues and adjacent tissues, ***p<0.001.
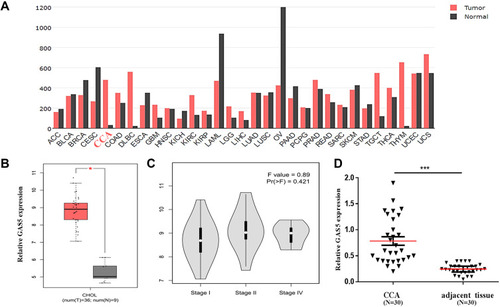
Table 1 Relationship Between GAS5 Expression and Clinical Features of CCA Patients
Figure 2 Knockdown of GAS5 suppressed RBE cell proliferation and invasion. (A) GAS5 is upregulated in CCA cell lines compared with that in the HIBEC cell, *p<0.05, **p<0.01. (B) qRT-PCR was used to detect the expression of GAS5 in RBE cells transfected with si-GAS5, **p<0.01. (C) CCK-8 assay was applied to observe the effect of GAS5 on RBE cell proliferation, **p<0.01. (D) Transwell assay was used to explore the role of GAS5 on RBE cell invasion. **p < 0.01 compared to the control group.
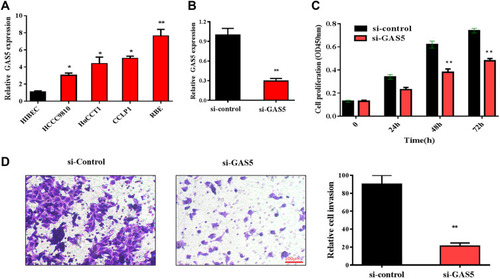
Figure 3 miR-1297 was the downstream target of GAS5, which was predicted and validated by bioinformatics analysis and luciferase reporter assay, respectively. (A) A chart screen the downstream target miRNAs of GAS5. (B) The complementary binding site of GAS5 and miR-1297. (C) Luciferase reporter assay was applied to verified the predicted binding of GAS5 and miR-1297. (D) qRT-PCR was applied to observe the expression of miR-1297 in RBE cell transfected with si-GAS5. (E) qRT-PCR was applied to detect the expression of miR-1297 of CCA tissues and adjacent normal tissues. (F) qRT-PCR was used to assess the expression of miR-1297 of CCA tissues with different stages. **p < 0.01, compared to the control group.
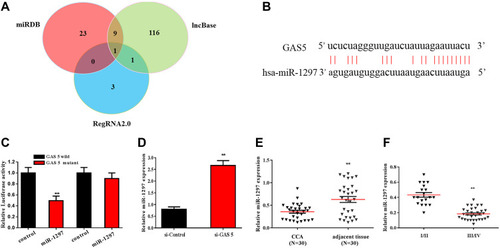
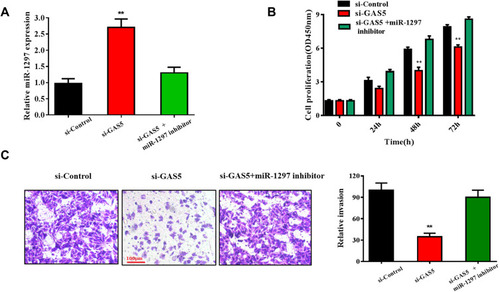
Figure 4 GAS5 promoted RBE cell proliferation and invasion through targeting miR-1297. (A) qRT-PCR was conducted to evaluate the expression of miR-1297 in RBE cell lines transfected with si-GAS5 and si-GAS5+miR-1297 inhibitor, respectively. (B) CCK-8 assay was used to observe the effect of si-GAS5+miR-1297 inhibitor on RBE cells proliferation ability. (C) Transwell assay was applied to detect the invasive capabilities of RBE cells transfected with si-GAS5 and miR-1297 inhibitor. **p < 0.01 compared to the control group.