Figures & data
Table 1 The Primers Used for Real-Time qPCR
Table 2 The Antibodies Used for Western Blot Analysis
Figure 1 LncRNA SNHG16, miR-17-5p and CCND1 were aberrantly expressed in the clinical tissues collected from patients with oral squamous cell carcinoma (OSCC). The 50 paired cancer and adjacent normal tissues were obtained from OSCC patients, and Real-Time qPCR analysis was conducted to examine the expression levels of (A) LncRNA SNHG16, (B) miR-17-5p and (C) CCND1 mRNA. The Pearson correlation analysis was next conducted, and the results showed that miR-17-5p negatively correlated with (D) LncRNA SNHG16 and (E) CCND1 mRNA, but (F) LncRNA SNHG16 was positively relevant to CCND1 mRNA in OSCC tissues. *P < 0.05.
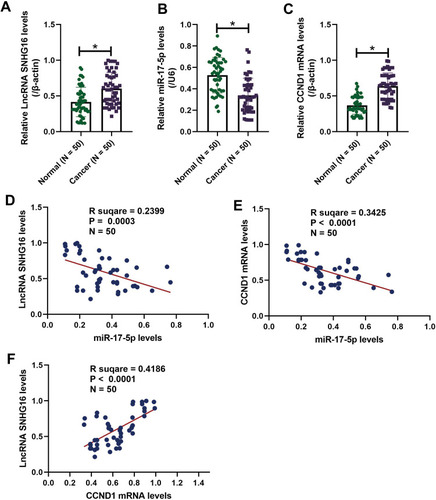
Figure 2 The expression status of LncRNA SNHG16, miR-17-5p and CCND1 in OSCC cells. The human normal oral cell line (NOK) and OSCC cell lines (CAL27, TCA8113, OEC-M1 and TW2.6) were obtained, and Real-Time qPCR was employed to determine the expression levels of (A) LncRNA SNHG16, (B) miR-17-5p and (C) CCND1 mRNA in the above cells. (D, E) Western Blot analysis was conducted to examine the protein levels of CCND1 in the OSCC cells. Each experiment repeated at least 3 times, and *P < 0.05.
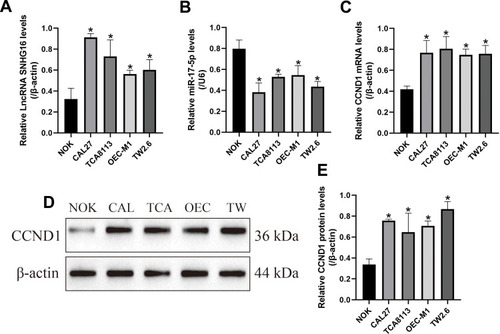
Figure 3 LncRNA SNHG16 promoted cell proliferation and growth, and inhibited cell apoptosis in OSCC cells (CAL27 and TCA8113) in vitro and in vivo. (A) The overexpression and downregulation vectors for LncRNA SNHG16 were delivered into the OSCC cells. (B, C) CCK-8 assay was performed to examine cell proliferation abilities in OSCC cells. (D) Knock-down of LncRNA SNHG16 triggered apoptotic cell death in OSCC cells. (E) The xenograft tumor-bearing mice models were established, and tumor weight was used to evaluate tumorigenesis of the OSCC cells. (Note: “Con” indicated “Control”, “OE” represented “LncRNA SNHG16 overexpression” and “KD” suggested “knock-down of LncRNA SNHG16”). Each experiment repeated at least 3 times, and *P < 0.05.
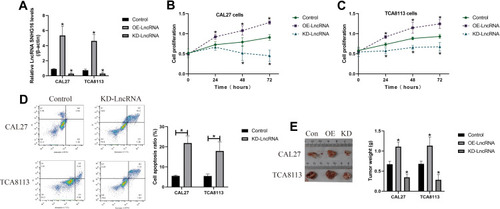
Figure 4 LncRNA SNHG16 positively regulated cell migration and EMT in OSCC cells. (A, B) Transwell assay was conducted to examine cell migration abilities. (C–F) Western Blot analysis was conducted to examine the expression levels of EMT-associated proteins (N-cadherin and Vimentin) in OSCC cells. (Note: “Con” indicated “Control”, “OE” represented “LncRNA SNHG16 overexpression” and “KD” suggested “knock-down of LncRNA SNHG16”). Each experiment repeated at least 3 times, and *P < 0.05.
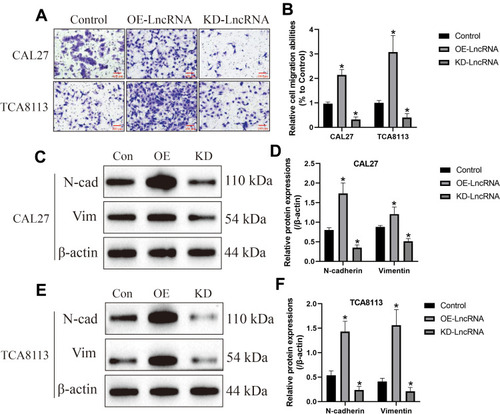
Figure 5 LncRNA SNHG16 sponged miR-17-5p to upregulate CCND1 in OSCC cells. The binding sites of miR-17-5p with (A) LncRNA SNHG16 and (D) 3ʹUTR of CCND1 mRNA were predicted by using the online starBase software (http://starbase.sysu.edu.cn/). The targeting sites of miR-17-5p with (B, C) LncRNA SNHG16 and (E, F) CCND1 mRNA were validated by using the dual-luciferase reporter gene system assay. (G) The mRNA and (H, I) protein levels of CCND1 were determined by Real-Time qPCR and Western Blot analysis, respectively. (Note: “Con” indicated “Control”, “KD-L” indicated “Knock-down of LncRNA SNHG16” and “KD-L+KD-miR” suggested “both LncRNA SNHG16 and miR-17-5p ablation”). Each experiment repeated at least 3 times, and *P < 0.05.
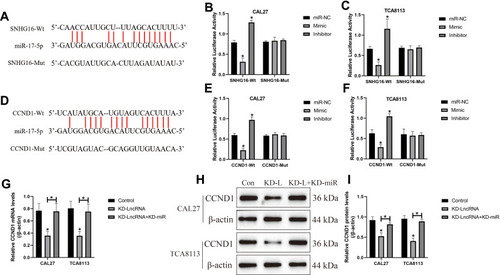
Figure 6 The role of LncRNA SNHG16/miR-17-5p/CCND1 axis in regulating OSCC cell proliferation and apoptosis. (A) The miR-17-5p mimic and inhibitor were transfected into OSCC cells for its overexpression and silencing. (B) CCND1 was overexpressed in OSCC cells. (C, D) CCK-8 assay was performed to examine cell proliferation abilities in OSCC cells. (E, F) Annexin V-FITC/PI double staining assay was used to determine cell apoptosis. Each experiment repeated at least 3 times, and *P < 0.05.
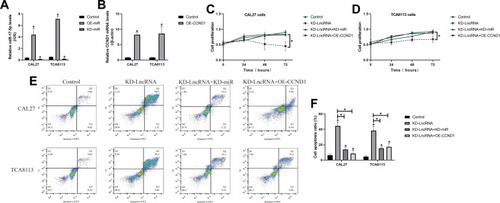
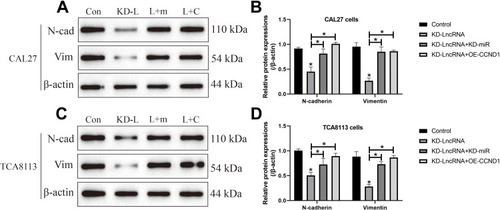
Figure 7 LncRNA SNHG16 regulated EMT in OSCC cells through targeting miR-17-5p/CCND1 axis. The expression levels of N-cadherin and Vimentin in (A, B) CAL27 and (C, D) TCA8113 cells were determined by using the Western Blot analysis. (Note: “Con” indicated “Control”, “KD-L” indicated “Knock-down of LncRNA SNHG16”, “L+M” indicated “Knock-down of LncRNA SNHG16 plus miR-17-5p silencing”, and “L+C” represented “LncRNA SNHG16 ablation plus CCND1 overexpression”). Each experiment repeated at least 3 times, and *P < 0.05.