Figures & data
Table 1 Association of RBP-Jκ and CXCL11 Protein Expression with Clinicopathological Features in 342 Colon Cancer Patients
Table 2 Primer Sequences for RT-PCR
Table 3 Association of RBP-Jκ and CXCL11 mRNA Expression with Clinicopathological Features in 342 Colon Cancer Patients
Figure 1 Immunohistochemical staining of RBP-Jκ and CXCL11 in colon cancer tissues and paratumorous tissues. (A–D) RBP-Jκ staining. (A) Paratumorous tissue. (B) Negative expression in colon cancer tissues. (C) Low expression in colon cancer tissues. (D) High expression in colon cancer tissues. (E–H) CXCL11 staining. (E) Paratumorous tissue. (F) Negative expression in colon cancer tissues. (G) Low expression in colon cancer tissues. (H) High expression in colon cancer tissues. Scale bar, 50μm.
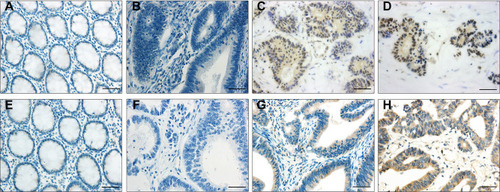
Table 4 Association Between RBP-Jκ and CXCL11 in 342 Colon Cancer Patients
Figure 2 Correlation between RBP-Jκ and CXCL11 mRNA expression in colon cancer tissues. The dot plot figure shows a positive correlation between RBP-Jκ and CXCL11 mRNA expression (Pearson’s rank test r=0.220; P<0.001). X-axis: CXCL11 mRNA expression level of each patient. Y-axis: RBP-Jκ mRNA expression level of each patient.
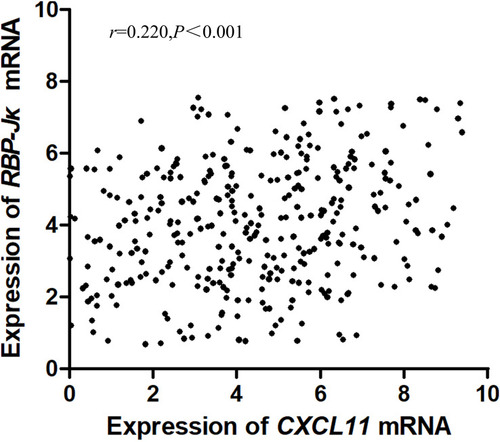
Table 5 Univariate and Multivariate Analyses of 342 Colon Cancer Patients
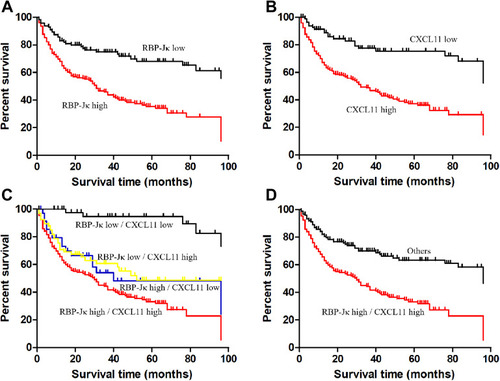
Figure 3 Kaplan-Meier survival curves showing significantly different survival rates for patients with CRC according to RBP-Jκ and CXCL11 expression. (A) Survival curves for RBP-Jκ. (B) Survival curves for CXCL11. (C) Survival curves for all patients divided by the combination of RBP-Jκ and CXCL11 status. (D) Survival curves for RBP-Jκ high/CXCL11 high and other combinations of RBP-Jκ/CXCL11 expression.