Figures & data
Figure 1 Flow chart of inclusion and exclusion criteria of the study sample.
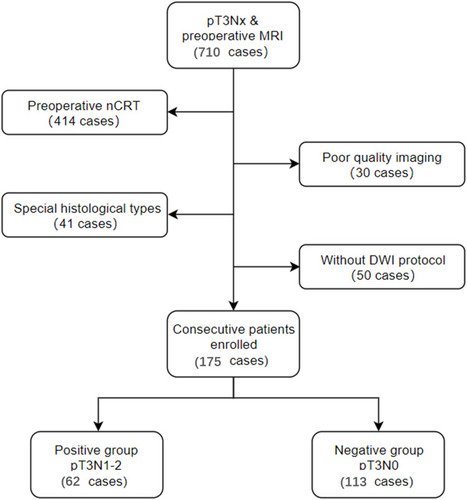
Figure 2 An example of manual segmentation of primary tumor on rectal cancer magnetic resonance imaging. (A) Maximum cross-section of primary tumor on T2-weighted (T2W) image in a T3 stage rectal cancer patient. (B) Maximum cross-section of primary tumor on diffusion-weighted (DW) image in the same patient. (C) Regions of interest were outlined directly along the margin of the whole tumor on maximum cross-section of the DW images, excluding the intraluminal gas, obvious necrosis and cystic areas using T2W imaging sequence as a reference standard (red region). (D) Copy of delineated area on the corresponding apparent diffusion coefficient map (magenta region).
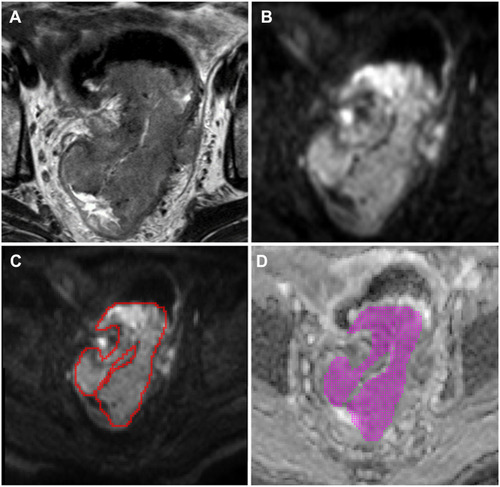
Table 1 Comparison of Clinical Data Between the LN− and LN+ Groups
Table 2 Comparison of Radiological Characteristics Between the LN− and LN+ Groups
Table 3 Comparison of ADC Histogram Parameters Between the LN− and LN+ Groups
Figure 3 A51-year-old male patient with confirmed pT3N1 rectal cancer. (A) Maximum axial T2-weighted image showing irregular thickening of the rectal wall with intermediate signal intensity in the lower segment of the rectum. (B) The corresponding maximum axial diffusion-weighted (DW) image with the same lesion for delineation of regions of interest (ROIs). (C) Corresponding apparent diffusion coefficient (ADC) map histogram copying from ROI of DW image showing that the ADC mean of 1.29×10³ s/mm2 and coefficient of variation of 0.163. (D) ADC pcolor map showing that the brighter the color, the greater the value.
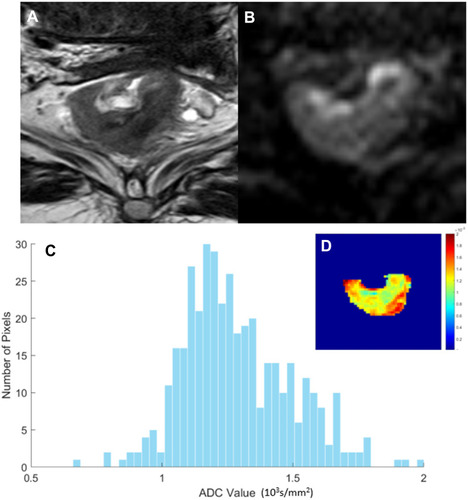
Figure 4 A 63-year-old male patient with confirmed pT3N0 rectal cancer. (A) Maximum axial T2-weighted image showing irregular thickening of the rectal wall with intermediate signal intensity in the lower segment of the rectum. (B) The corresponding maximum axial diffusion-weighted image (DW) image of the same lesion for delineation of regions of interest (ROIs). (C) The corresponding apparent diffusion coefficient (ADC) map histogram copied from ROI of DW image showing ADC mean of 0.96×10³ s/mm2 and coefficient of variation of 0.183. (D) ADC pcolor map showing that the brighter the color, the greater the value.
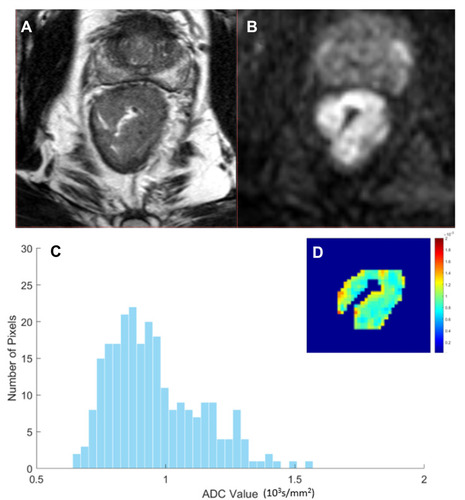
Table 4 Univariate and Multivariate Analyses
Table 5 Predictive Efficacy of the Four Independent Predictive Factors Model and Combined Model
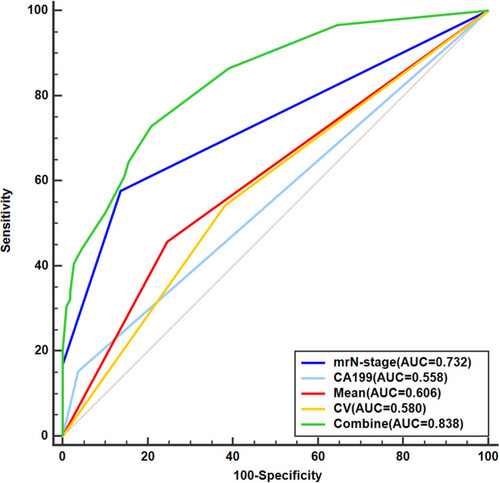
Figure 5 Receiver operating characteristic curves and area under the curve values for mrN-stage, carbohydrate antigen 199, apparent diffusion coefficient (ADC) mean, ADC coefficient of variation and combined model with above parameters in predicting pathological lymph node metastasis.