Figures & data
Table 1 Primer List
Figure 1 PCAT18 expression was up-regulated in NSCLC tissues and cell lines. (A) Expression of PCAT18 in 30 NSCLC tissues and paired normal lung tissues based on RT-qPCR. (B) Expression of PCAT18 in the HBE cells and NSCLC cell lines based on RT-qPCR. **p < 0.01.
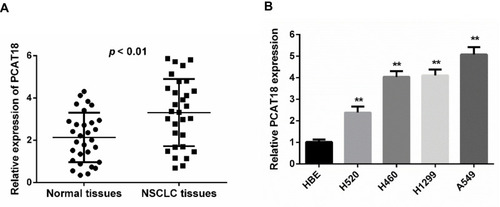
Figure 2 Continued.
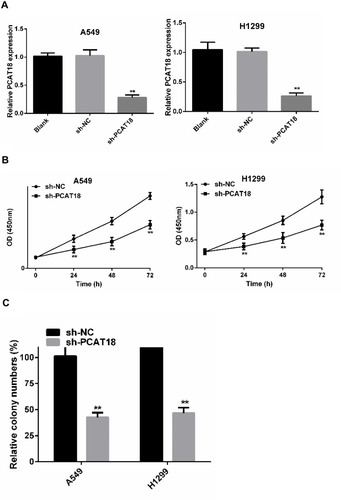
Figure 2 PCAT18 silence inhibited proliferation of NSCLC cells. (A) Relative expression of PCAT18 in A549 and H1299 cells of different groups. (B) CCK8 assays were performed to determine cell proliferation. (C) Colony formation assay was conducted to determine cell proliferation. (D) Apoptosis status of different groups cells was assessed by flow cytometry. (E) Cell cycle was examined by flow cytometry. **p < 0.01.
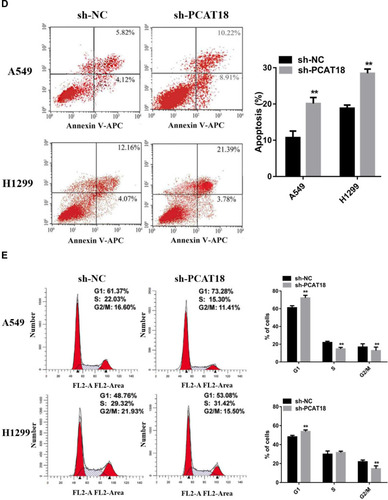
Figure 3 PCAT18 silence inhibited migration and invasion of NSCLC cells. (A) Wound healing assay was performed to determine cell migration. (B) Transwell assay was performed to determine cell invasion. **p < 0.01.
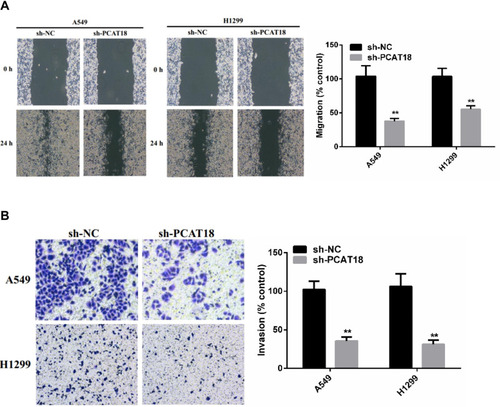
Figure 4 The reciprocal repression effect of PCAT18 and miR-4319. (A) Subcellular fractionation assay was used to determine the subcellular localization of PCAT18. (B) Expression levels of miR-4319 in A549 and H1299 cells after the knockdown of PCAT18. (C) qPCR analysis of PCAT18 after cells were transfected with miR-4319 mimic. (D) qPCR analysis of PCAT18 after cells were transfected with miR-4319 inhibitor. (E) Expression of miR-4319 in 30 NSCLC tissues and paired normal lung tissues based on RT-qPCR. (F) The association between PCAT18 and miR-4319 was examined. (G) Expression of miR-4319 in the HBE cells and NSCLC cell lines based on RT-qPCR. **p < 0.01.
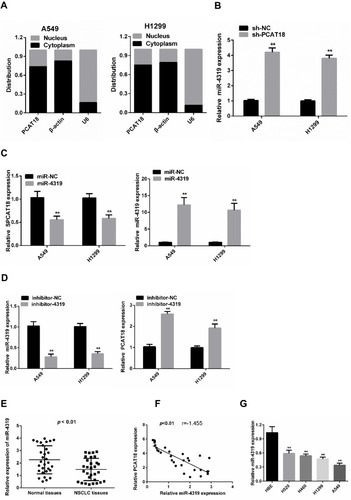
Figure 5 PCAT18 and miR-4319 directly target each other. (A) Binding site of PCAT18 and miR-4319. (B) Relative luciferase activity in cells of different groups. (C) RIP assays were conducted to evaluate the amount of PCAT18 and miR-4319 bound to Ago2. (D) Mount of PCAT18 bound to biotin-labelled miR-4319 mimic or biotin-labelled NC. RNA pull-down assays were performed after 24 hrs of transfection. **p < 0.01.
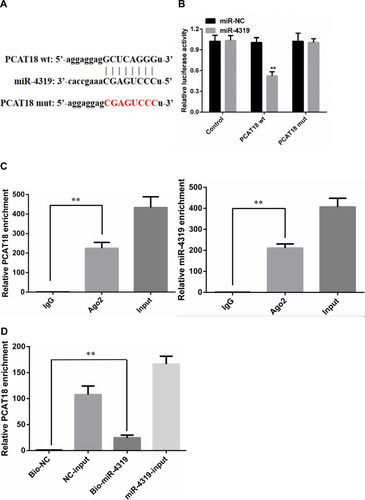
Figure 6 Oncogenic functions of PCAT18 in NSCLC cells were partially reversed by co-transfection with a miR-4319 inhibitor. (A) Colony formation assays to measure proliferation of NSCLC cells that were stably transfected with sh-PCAT18 and miR-4319 inhibitor or NC. (B) Wound healing assays to examine migration of NSCLC cells that were stably transfected with sh-PCAT18 and miR-4319 inhibitor or NC. (C) Transwell invasion assays to measure invasion of NSCLC cells that were stably transfected with sh-PCAT18 and miR-4319 inhibitor or NC. (D) miR-4319 impaired tumor growth of NSCLC in vivo. **p < 0.01.
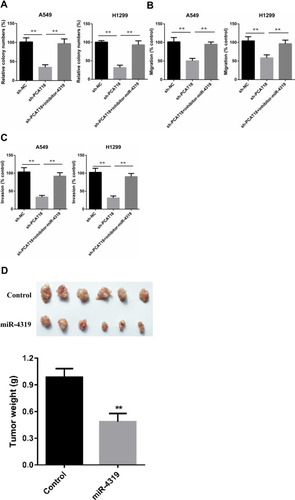
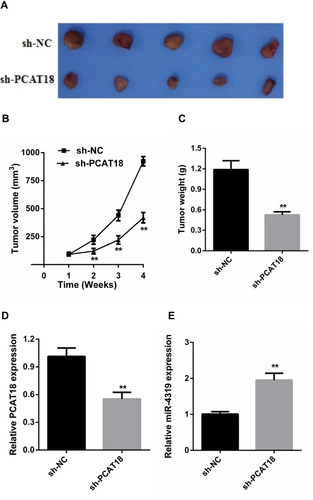
Figure 7 PCAT18 silence inhibited tumor growth in vivo. (A) The tumour volumes in the sh- PCAT18 and sh -NC groups were measured at 4 weeks after injection. (B) The tumor volumes of the mice were measured every week after the cell injection. (C) At 4 weeks later, the mice were killed, and the tumor tissues were excised and the weight of tumors was measured. (D) Expression levels of PCAT18 in tumors. (E) Expression levels of miR-4319 in tumors. **p < 0.01.