
Figures & data
Table 1 Scoring System for High-Risk Group
Table 2 Sociodemographic and Clinical Characteristics of Participants (n = 88)
Table 3 Sociodemographic and Clinical Aspects in Correlation with Compliance
Table 4 The Correlation Between Compliance in Each Risk Group and RR, PR, and MR
Table 5 The Correlation Between Compliance to Both Cystoscopy and BCG to RR, PR, MetsR and MR in High-Risk Group
Table 6 The Correlation Between BCG Compliance to RR, PR, MetsR and MR in Non-Compliant Patients in High-Risk Group
Figure 1 Comparison of the estimated probability of mortality among compliant versus non-compliant patients in the follow-up of NMIBC based on the Kaplan–Meier method for 5 years post-diagnosis.
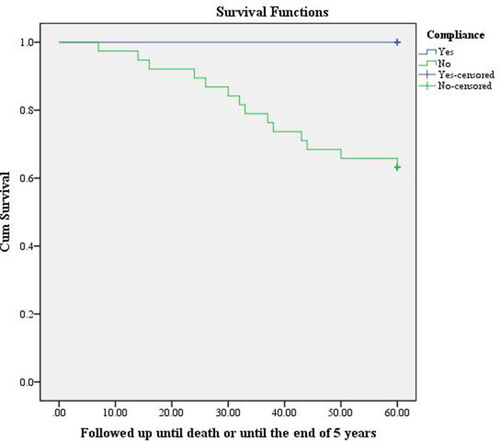
Table 7 Novel Scoring System to Predict Recurrence, Progression and Mortality in the High-Risk Group