
Figures & data
Table 1 Clinicopathological Features of Breast Cancer Patients in GDPH and TCGA Databases
Figure 1 The mutation rates of AKT, AKT1, AKT2, and AKT3 in GDPH and TCGA cohorts of patients with breast cancer.
Abbreviations: GDPH, Guangdong Provincial People’s Hospital; TCGA, The Cancer Genome Atlas.
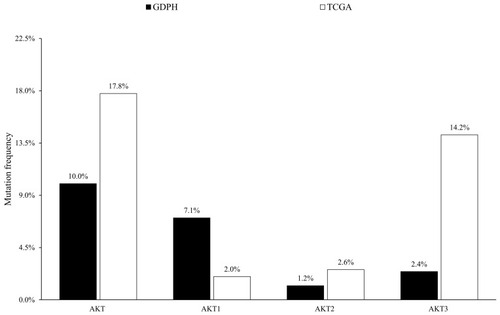
Figure 2 The frequency of different mutation types of (A) AKT, (B) AKT1, AKT2, and AKT3 in the two cohorts.
Abbreviations: GDPH, Guangdong Provincial People’s Hospital; TCGA, The Cancer Genome Atlas; AMP, copy number amplification; HOMDEL, homozygous deletions.
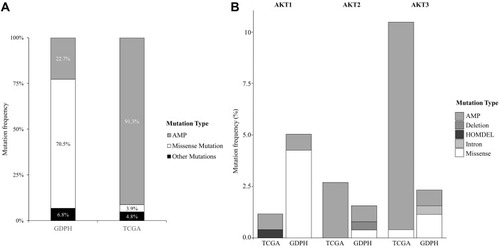
Figure 3 Diagram of domains of (A) AKT1, (B) AKT2 and (C) AKT3 with mutations identified in the GDPH cohort.
Abbreviation: PH, pleckstrin homology.
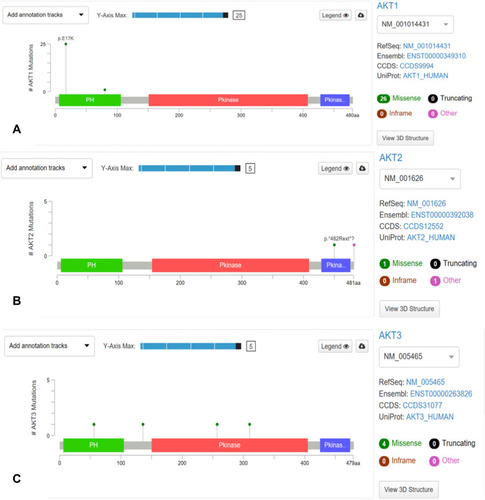
Table 2 Correlation Between Clinicopathological Features and AKT Family Mutation in GDPH and TCGA Databases
Table 3 AKT Inhibitors in Clinical Development