
Figures & data
Table 1 The Distribution of Primary Sites and Survival Statistics of 220 PENL Cases
Table 2 The Pathological Subtypes of PENL Patients
Figure 1 The pathology of patients with PENL. (A) The pathology of DLBCL (primary site from central nervous system). (B) The pathology of mucosa-associated lymphoid tissue lymphoma (primary site from stomach) magnification ×200.
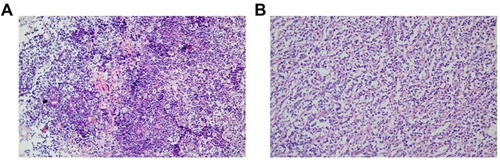
Table 3 The Risk Categories of PENL Patients According to IPI Score
Figure 2 The influences of ECOG scores, serum LDH levels, β2-MG levels and pathological subtypes on OS and PFS of PENL patients. (A) The influences of ECOG scores on patients’ OS. (B) The influences of ECOG scores on patients’ PFS. (C) The influences of serum LDH levels on OS of patients. (D) The influences of serum LDH levels on PFS of patients. (E) The influences of serum β2-MG levels on patients’ OS. (F) The influences of β2-MG levels on patients’ PFS. (G) The influences of pathological subtypes on OS of patients. (H) The influences of pathological subtypes on PFS of patients.
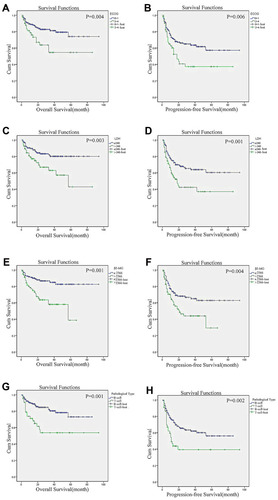
Figure 3 Comparison of the influences of extranodal involvement degree and sex on both patients’ OS and PFS. (A) Comparison of the influences of extranodal involvement degree on patients’ OS. (B) Comparison of the influences of extranodal involvement degree on patients’ PFS. (C) Comparison of the influences of sex on patients’ OS. (D) Comparison of the influences of sex on patients’ PFS.
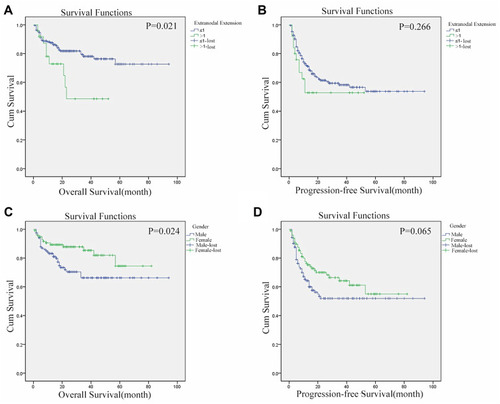
Figure 4 The influences of ESR on OS and PFS of PENL patients. (A) The influences of ESR on patients’ OS. (B) The influences of ESR on patients’ PFS.
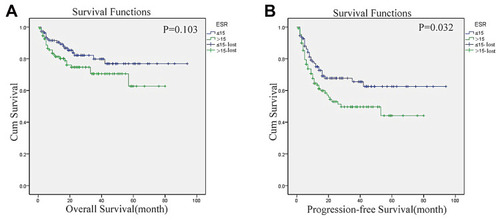
Figure 5 Comparison of age and clinical staging on both patients’ OS and PFS. (A) Comparison of age on patients’ OS. (B) Comparison of age on patients’ PFS. (C) Comparison of clinical staging on patients’ OS. (D) Comparison of clinical staging on patients’ PFS.
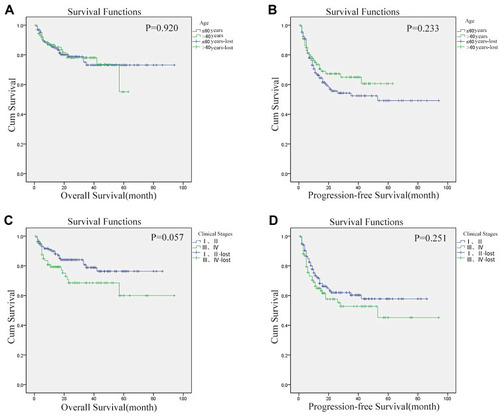
Table 4 The Cox Regression Model Multivariate Prognostic Analysis of PENL Cases