Figures & data
Table 1 Preoperative Demographic Information and Pathological Features
Table 2 Comparison Between CTCNegative and CTCPositive Groups
Table 3 Comparison Between CTC-Negative and CTC-Positive Groups in Different Tumor Stages in Patients with Colon Cancer and Rectal Cancer
Table 4 Comparison Between CTC-Negative and CTC-Positive Groups in Different Stages in Patients with Left- and Right-Side CRC
Figure 1 Survival curve and risk curve in the CRC cohort. (A) Survival curve in the CRC cohort. (B) Risk curve in the CRC cohort.
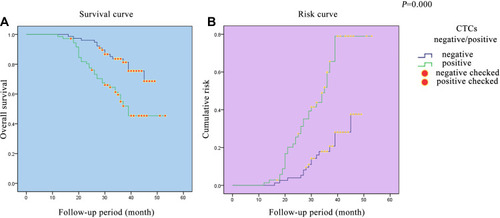
Figure 2 Progression-free survival curve and risk curve of colorectal patients. (A) Progression-free survival curve of colorectal patients. (B) Risk curve of colorectal patients.
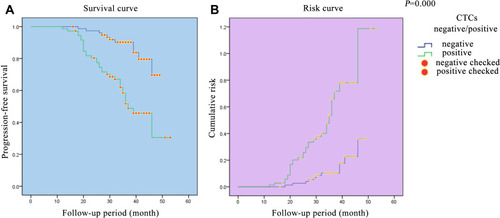
Figure 3 Survival curves and risk curves of colorectal patients in different stages. (A) Survival curve of colorectal patients in stage I. (B) Survival curve of colorectal patients in stage II. (C) Survival curve of colorectal patients in stage III. (D) Survival curve of colorectal patients in stage IV. (E) Risk curve of colorectal patients in stage I. (F) Risk curve of colorectal patients in stage II. (G) Risk curve of colorectal patients in stage III. (H) Risk curve of colorectal patients in stage IV.
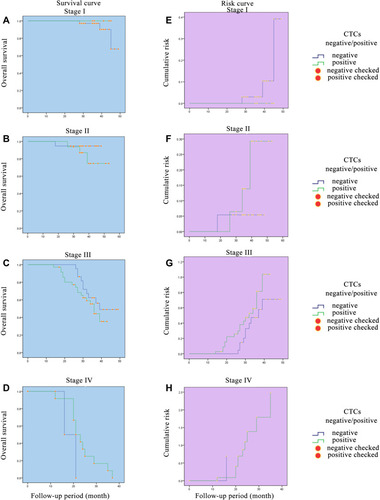
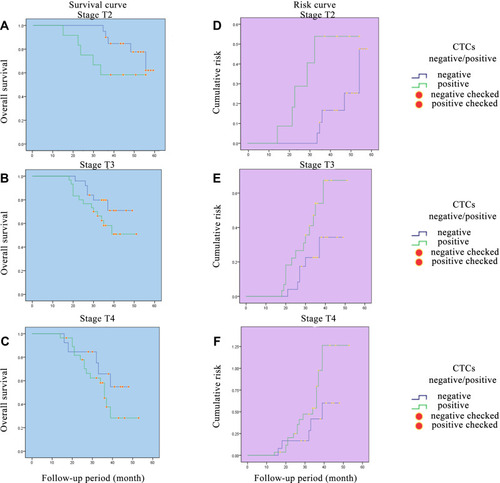
Figure 4 Survival curves and risk curves of colorectal patients in different T stages. (A) Survival curve of colorectal patients in stage T2. (B) Survival curve of colorectal patients in stage T3. (C) Survival curve of colorectal patients in stage T4. (D) Risk curve of colorectal patients in stage T2. (E) Risk curve of colorectal patients in stage T3. (F) Risk curve of colorectal patients in stage T4.