
Figures & data
Figure 1 Scoring criteria for PSPC1 expression in IHC.
Notes: Pictures of IHC processed at identical conditions for PSPC1 expression were taken and scored. (A) – (negative). (B) + (weak). (C) ++ (moderate). (D) +++ (strong). Images were taken under light microscope (200×). Scale bar=50 μm.
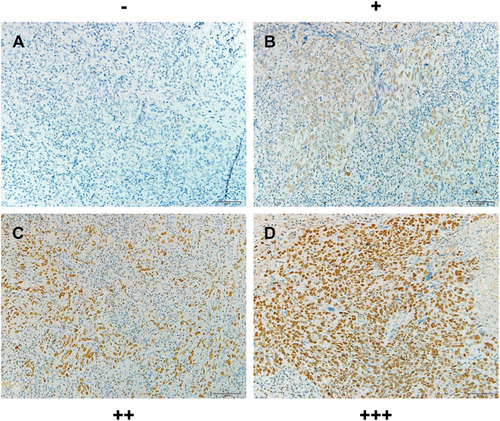
Figure 2 Percentage distribution of PSPC1 IHC score in NPC tissues versus normal tissues.
Notes: The PSPC1 staining intensity was scored and the distribution of IHC score was expressed as the percentage in NPC and normal tissues. Chi-square test was used to compare IHC scores in NPC tissues versus normal tissues. ***P <0.001.
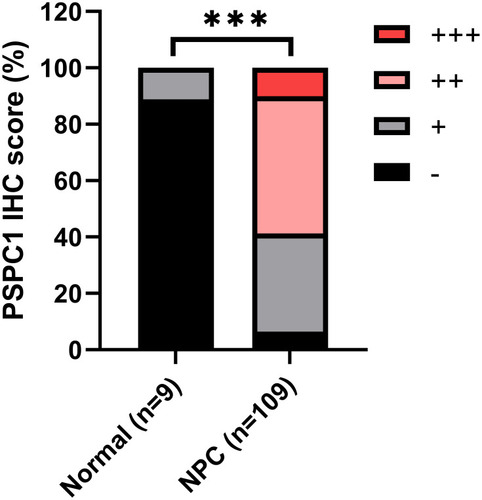
Table 1 Associations of PSPC1 Expression with Pathological Characteristics in NPC Patients
Figure 3 Differences of PSPC1 expression among the normal tissues, radiosensitive NPC tissues and radioresistant NPC tissues.
Notes: Representative pictures of Normal (normal nasopharyngeal epithelial tissues). RS-NPC (radiosensitive NPC tissues) and RR-NPC (radioresistant NPC tissues) were taken after IHC under a light microscope. The staining intensity was compared. The image amplification was 200×. Scale bar=50 μm.
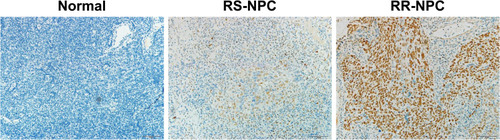
Table 2 Correlation Between PSPC1 Expression and 3-Year Outcomes in NPC Patients
Figure 4 High PSPC1 expression predicts inferior outcomes in NPC patients.
Notes: Survival data were analyzed and plotted using the Kaplan–Meier method. The NPC patients were classified into Low PSPC1 or High PSPC1 according to IHC score. (A) Overall Survival (OS). (B) Progression-free survival (PFS). (C) Locoregional recurrence-free survival (LRRFS). (D) Distant metastasis-free survival (DMFS).
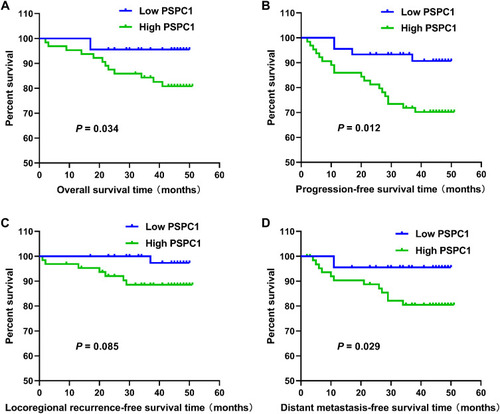
Table 3 Univariate Log Rank Analyses of Prognostic Parameters of NPC
Table 4 Multivariate Survival Analyses of Prognostic Parameters of NPC