Figures & data
Table 1 Correlation of miR-145-5p Expression with Clinicopathological Characteristics in Hepatocellular Carcinoma
Figure 1 miR-145-5p was downregulated in HCC and was associated with poor prognosis. (A) Expression of miR-145-5p was measured by real-time PCR in HCC tissues and their matched ANLTs. ***P<0.001 compared with ANLTs. (B) Expression of miR-145-5p in HCC cell lines (Huh7, MHCC97L, MHCC97H, HCCLM3, and Hep3B) and a normal liver cell line (THLE-2). *P<0.05 compared with the THLE-2 cell line. (C) RT-qPCR was used to detect miR-145-5p expression in the normal liver group, nontumor chronic hepatitis group, hepatitis cirrhosis group, and HCC group (n=15 per group). Blood tests were used to diagnose whether the patient has HBV infection. Ultrasound, CT scan and liver biopsy were used to assess whether the patients had cirrhosis. Patients without hepatitis and cirrhosis were included in the normal liver group. Hepatitis patients without cirrhosis and HCC were included in the nontumor chronic hepatitis group. Hepatitis cirrhosis patients without HCC were included in the hepatitis cirrhosis group. *P<0.05 and ***P<0.001 compared among groups. (D) After 5 years of follow-up, the 2-year disease-free survival rate and 5-year overall survival rate of HCC patients were calculated by the Kaplan–Meier method. The red line represents the high miR-145 high expression group. The blue line represents the low miR-145 expression group. The data are presented as the mean ± standard deviation values.
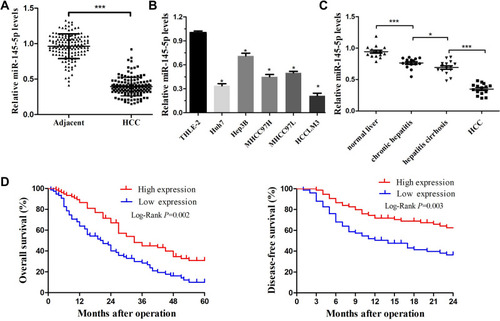
Figure 2 miR-145 inhibited proliferation, migration, and invasion and induced apoptosis in HCC cell lines. (A) The miR-145-5p mimics and negative control were efficiently transfected into HCCLM3 cells. (B) Cell proliferation rates were measured in two groups of HCCLM3 cells by a CCK-8 assay after 24 h, 48 h and 72 h. (C) Flow cytometric analysis was used to determine the apoptosis rates of HCCLM3 cells. (D) The invasive ability of transfected HCCLM3 cells was evaluated by a Transwell assay (magnification, 200×). (E) Migration rates of HCCLM3 cells were determined by a wound healing assay. (F) The expression of miR-145-5p was measured in THLE-2 cells transfected with the miR-145-5p inhibitor or negative control. (G) Migration rates of THLE-2 cells were confirmed by a wound healing assay. *P<0.05, **P<0.01 and ***P<0.001 compared with the NC group. The data are presented as the mean ± standard deviation values.
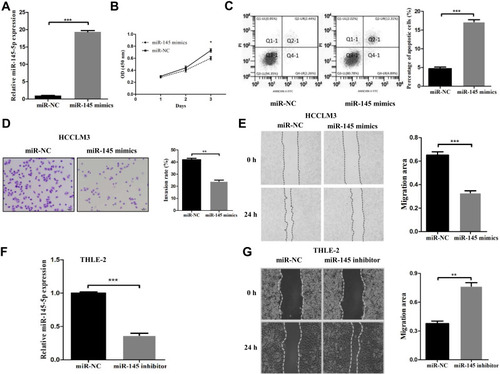
Figure 3 ARF6 was proven to be a novel target of miR-145-5p in HCCLM3 cells. (A) ARF6 had a predicted consequential pairing with miR-145-5p at nucleotide positions 2171–2177. psiCHECK2 dual-luciferase reporter vectors containing WT or MT ARF6 3ʹ-UTR were constructed. (B) Renilla luciferase activity was normalized to firefly luciferase activity in HCCLM3 cells expressing WT-ARF6 or MT-ARF6. (C) After transfection with miR-145 mimics, the ARF6 levels were significantly decreased in HCCLM3 cells. (D) RT-qPCR was performed to measure the expression level of ARF6 in THLE-2 cells. **P<0.01 compared with the 3ʹ-UTR+miR-145 mimics group and ***P<0.001 compared with the NC group. The data are presented as the mean ± standard deviation values.
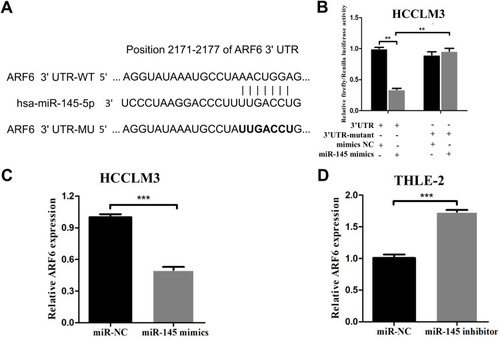
Figure 4 Overexpression of ARF6 counteracted the effects of miR-145-5p in HCCLM3 cells. (A) The mRNA level of ARF6 increased after transfection of ARF6 lentiviral activation particles. ***P<0.001 compared with the control lentiviral activation particles. (B) ARF6 levels were measured by RT-qPCR in HCCLM3 cells. (C) Migration rates of HCCLM3 cells were confirmed by a wound healing assay. (D) The invasive ability of transfected HCCLM3 cells was measured by Transwell assay (magnification, 200×). (E) Apoptosis induced by miR-145 was reversed by ARF6. (F) The effects of miR-145 and ARF6 on the cell division cycle were measured by cell cycle analysis. **P<0.01 and ***P<0.001 compared with the miR-145 mimics group. The data are presented as the mean ± standard deviation values.
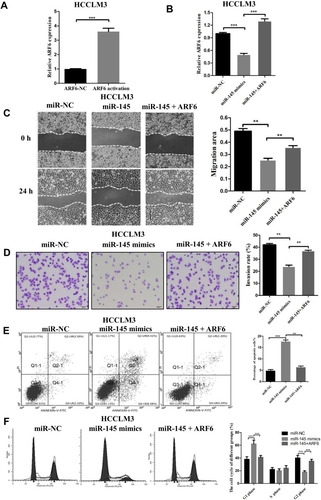
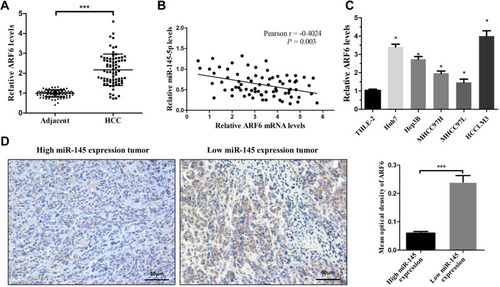
Figure 5 ARF6 was significantly upregulated in HCC tissues and negatively correlated with miR-145 in HCC. (A) Real-time PCR was performed to measure ARF6 mRNA levels in HCC tissues and their matched ANLTs (n=75). ***P<0.001 compared with ANLTs. (B) In HCC tissues, ARF6 levels were negatively correlated with miR-145-5p levels (n=75). (C) ARF6 mRNA levels were measured in HCC cell lines and THLE-2 cells. *P<0.05 compared with THLE-2 cells. (D) Representative immunohistochemical images of ARF6 expression in HCC tissues with different miR-145 levels. ***P<0.001 compared between the two groups. The data are presented as the mean ± standard deviation values.