Figures & data
Figure 1 Typical TICs of metabolic profiles in the anlotinib and control groups. (A) The anlotinib group in positive ion mode. (B) The anlotinib group in negative ion mode. (C) The control group in positive ion mode. (D) The control group in negative ion mode.
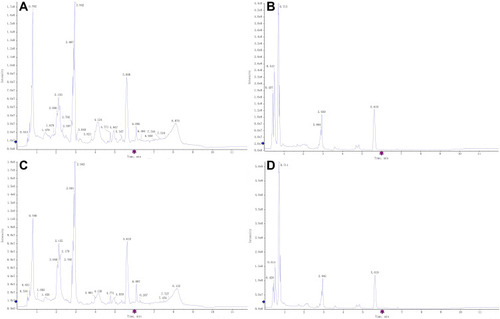
Figure 2 (A) PCA score plot and (B) OPLS-DA score plot between the anlotinib and control groups. The blue points represent the samples in the anlotinib group, and the red points represent the samples in the control group. (C) The 200 permutation test.
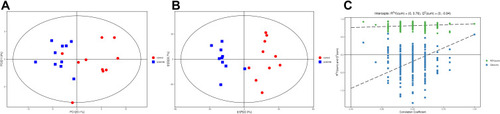
Table 1 Metabolites and Their Related Metabolic Pathways in the Anlotinib and Control Groups
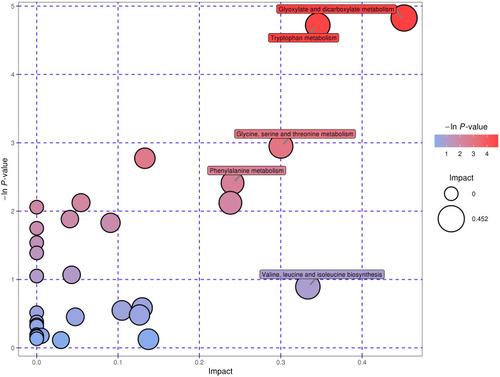
Figure 3 Pathway enrichment analysis and summary of pathway impact based on KEGG pathway networks.