
Figures & data
Figure 1 Flow diagram for selection of study cohort and nested case–control participants.
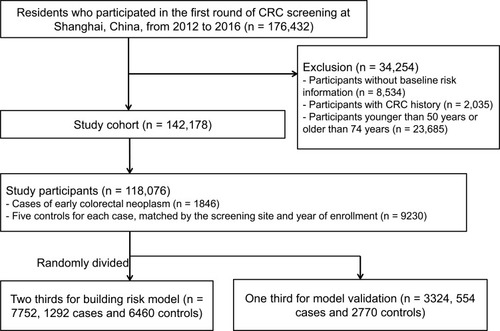
Table 1 Characteristics of Participants in the Training and Validation Sets
Table 2 Baseline Characteristics of Cases of Early Colorectal Neoplasm and Controls in the Training and Validation Datasets
Table 3 Univariate and Multivariate Predictors of Early Colorectal Neoplasm in the Training Set
Figure 2 ROC curves for early colorectal neoplasm risk predictions. The yellow solid line is reference line. The solid line with blue is for risk model with only age and family history of first-degree relatives with CRC. The green line is for risk model with age, family history of first-degree relatives with CRC and lifestyle risk factors. The horizontal line corresponds to 1-specificity. The vertical line corresponds to sensitivity.
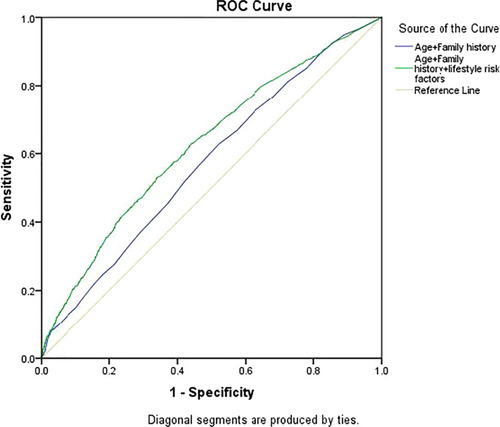
Table 4 Sensitivity and Specificity of Early Colorectal Neoplasm Risk-Based Model at Different Predicted Risk Cutoff Values
Table 5 Summary of Risk Prediction Models for CRC and ACN