Figures & data
Figure 1 AVL9 expression in CRC and normal tissues detected using bioinformatics methods.
Notes: (A) AVL9 expression in CRC tissues and normal tissues was analyzed using the GEPIA database. *P < 0.05. (B) AVL9 expression was upregulated in CRC using the GSE32323 GEO dataset. (C) TCGA data also indicated that AVL9 expression was upregulated in CRC versus normal tissues.
Abbreviations: CRC, colorectal cancer; TCGA, The Cancer Genome Atlas.
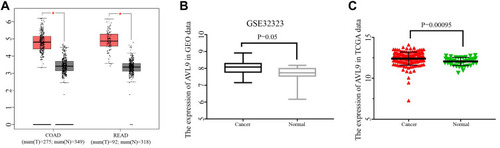
Figure 2 Analysis of the relationship between AVL9 expression and prognosis using bioinformatics methods.
Notes: (A and B) Kaplan–Meier survival analyses of OS using the TCGA data. (C and D) Kaplan–Meier survival analyses of DFS using GEO data.
Abbreviations: TCGA, The Cancer Genome Atlas; GEO, Gene Expression Omnibus; OS, overall survival; DFS, disease-free survival.
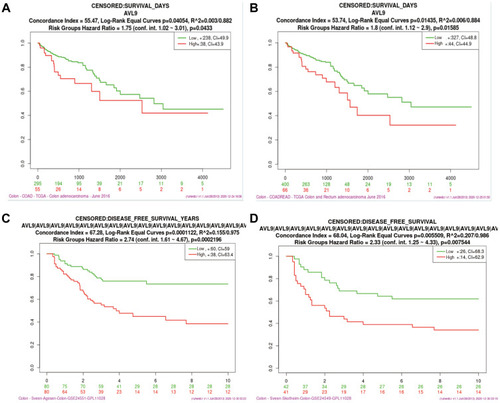
Figure 3 Bioinformatics analysis of genes related to AVL9 expression.
Notes: (A) A total of 160 AVL9 relative genes were common between the results of the LinkedOmics and cBioportal databases. (B) GO analysis of AVL9 expression-related genes. (C) KEGG analysis of AVL9 expression-related genes.
Abbreviations: GO, gene ontology; KEGG, Kyoto Encyclopedia of Genes and Genome.
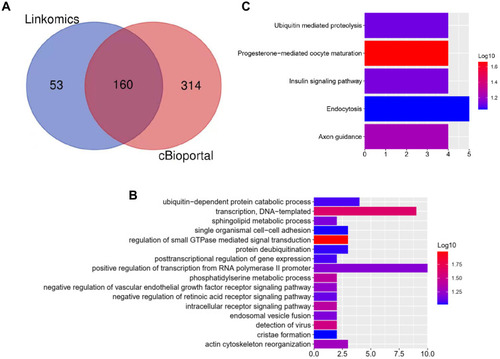
Figure 4 PPI network analysis of AVL9 expression-related genes and key gene predictions.
Notes: The nodes represent proteins, the edges represent the interaction of proteins, and the color depth of a node in the PPI network reflects interaction strength (order of interaction intensity: red> deep yellow > medium yellow > light yellow > purple > blue).
Abbreviation: PPI, protein–protein interaction.
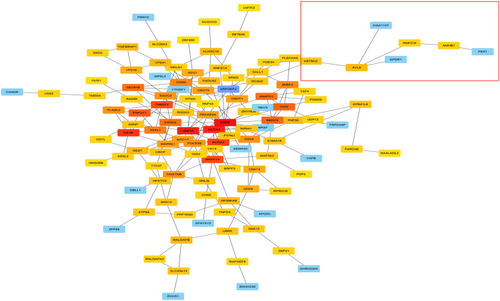
Table 1 AVL9 Expression and Clinicopathological Features in Patients with Colorectal Cancer
Table 2 Univariate and Multivariate Analyses of Clinical Pathological Factors of OS in 50 Patients with CRC
Figure 5 Expression level of AVL9 in CRC tissues.
Notes: (A) AVL9 was up-regulated in CRC tissues and analyzed by the reverse transcription–quantitative polymerase chain reaction assay. (B) Correlation between AVL9 expression and overall survival. (C) The expression of AVL9 was significantly higher in patients with TNM stage III or IV. (D) AVL9 expression in patients with poor to moderate tumor differentiation was increased. (E) The receiver operating characteristic curve for predicting CRC was analyzed using normal tissues as a control. The cutoff value was 1.296, with a sensitivity of 0.729 and specificity of 0.640, and the AUC was 0.6830. **P < 0.01.
Abbreviations: CRC, colorectal cancer; AUC, area under the curve.
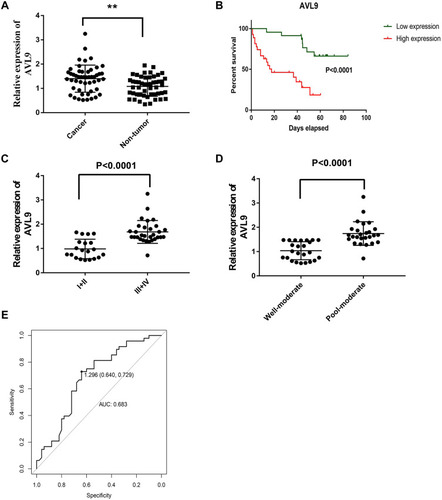
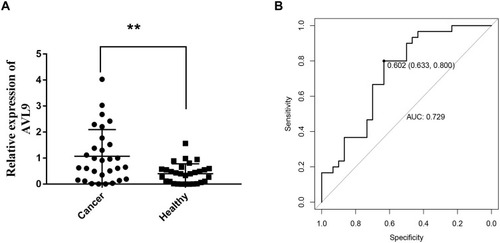
Figure 6 Diagnostic utility of circulating AVL9 was tested in 30 CRC patients and 30 healthy subjects.
Notes: (A) Expression levels of circulating AVL9 were upregulated in CRC patients versus healthy controls. (B) The AUC was 0.729. The cutoff value was 0.602, with a sensitivity of 0.800 and a specificity of 0.633. **P < 0.01.
Abbreviations: CRC, colorectal cancer; AUC, area under the curve.