Figures & data
Table 1 Summary of the ERAS Protocols and Comparison with Conventional Perioperative Management
Table 2 Clinical Characteristics of the Patients Undergoing Hepatectomy Between ERAS Group and Non-ERAS Group
Figure 1 Flow diagram detailing the selection process for patients included in this retrospective analysis.
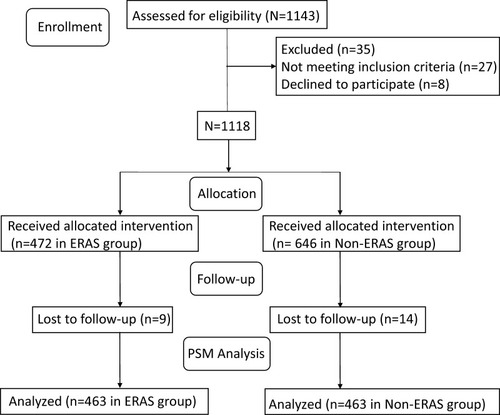
Table 3 Univariate Analysis of OS and DFS
Table 4 Multivariable Cox Proportional of OS and DFS
Figure 2 (A) Disease-free survival curves from the date of surgery between ERAS group and non-ERAS group; (B) overall survival curves from the date of surgery between ERAS group and non-ERAS group.
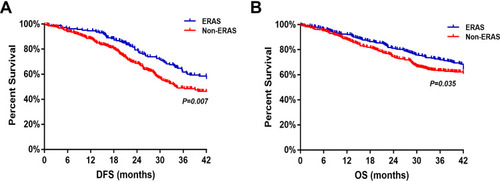
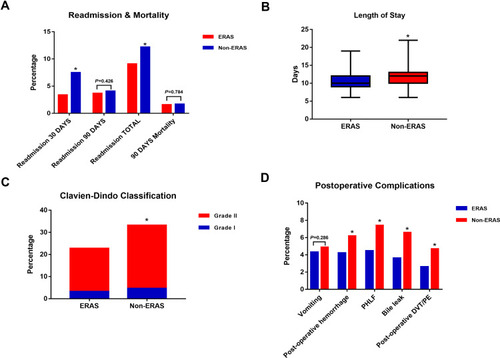
Figure 3 (A) Readmission rate and mortality between the ERAS group and non-ERAS group; (B) hospital length of stay between groups. (C) The percentage of postoperative complications between groups according to Clavien-Dindo classification; (D) postoperative complications between groups. *P<0.001.