Figures & data
Table 1 Group comparison (mean ± standard deviation, range, or rate)
Figure 1 Comparison of the amount of drained fluid drained from the axilla between group 1 (surgery based on cutting and coagulation) and group 2 (surgery based on clamping and ligatures).
Note: The difference between the groups was not statistically significant.
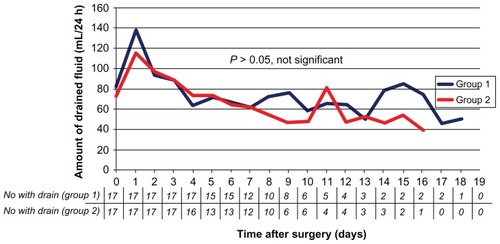
Table 2 Comparison of the outcome variables between group 1 and group 2 (mean ± standard deviation, range, or rate)
Figure 2 Positive correlation between the number of resected LNs and the total amount of fluid drained from the axilla (P = 0.006; A) and a positive correlation between the number of resected LNs and the duration of the drain (P = 0.015; B).
Abbreviation: LNs, lymph nodes.
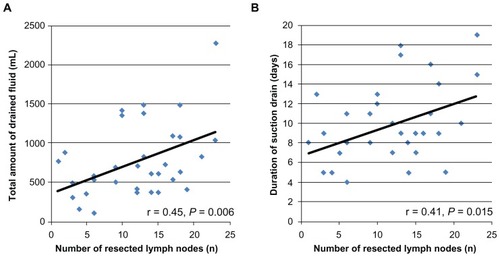
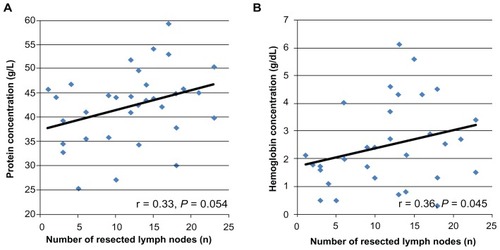
Figure 3 Positive correlation between the number of resected LNs and the protein concentration in the drained fluid (P = 0.054; A) and a positive correlation between the number of resected LNs and hemoglobin in the drained fluid (P = 0.045; B).
Abbreviation: LNs, lymph nodes.