Figures & data
Figure 1 GSPs regulated hsa_circ_0070934 expression and the malignant progression of CSCC. A431 and SCL-1 cells were treated with different concentrations of GSPs for 24 h. (A and B) The expression of hsa_circ_0070934 was measured by qRT-PCR. MTT assay (C and D) and colony formation assay (E) were used to detect cell viability and the number of colonies to assess cell proliferation. (F–H) Flow cytometry was performed to determine the cell cycle process and apoptotic cells. (I and J) The numbers of migrated and invaded cells were evaluated by transwell assay. (K) The protein levels of PCNA, c-caspase 3/caspase 3 and MMP-3 were examined using WB analysis. *P < 0.05.
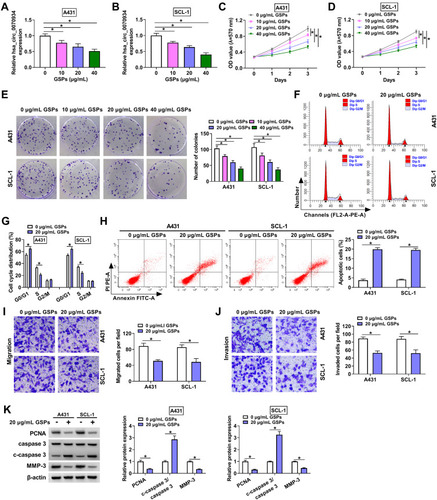
Figure 2 GSPs inhibited CSCC cell progression by regulating hsa_circ_0070934. (A) The transfection efficiency of hsa_circ_0070934 overexpression vector was assessed by detecting hsa_circ_0070934 expression in A431 and SCL-1 cells using qRT-PCR. (B–L) A431 and SCL-1 cells were transfected with Vector or hsa_circ_0070934 overexpression vector, and then treated with GSPs. Non-transfected cells were used as GSPs group. Non-transfected and non-treated cells were used as control group. (B) QRT-PCR was employed to detect hsa_circ_0070934 expression. Cell viability and the number of colonies were determined using MTT assay (C and D) and colony formation assay (E) to evaluate cell proliferation. (F–H) Cell cycle process and apoptotic cells were measured by flow cytometry. (I–K) Transwell assay was performed to assess the numbers of migrated and invaded cells. (L) WB analysis was utilized to test the protein levels of PCNA, c-caspase 3/caspase 3 and MMP-3. *P < 0.05.
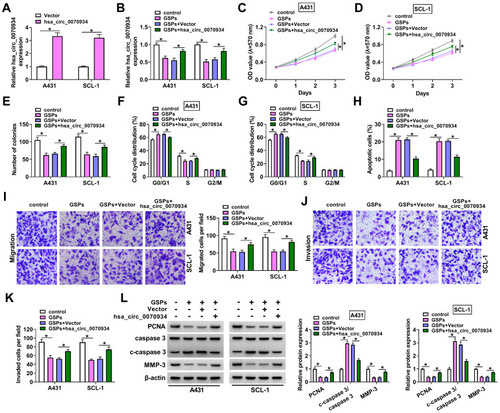
Figure 3 Hsa_circ_0070934 could serve as a sponge of miR-136-5p. (A) The binding sites and mutant sites between hsa_circ_0070934 and miR-136-5p were shown. (B) QRT-PCR was used to detect miR-136-5p expression to confirm the transfection efficiency of miR-136-5p mimic. Dual-luciferase reporter assay (C and D) and RIP assay (E and F) were utilized to assess the interaction between hsa_circ_0070934 and miR-136-5p. (G) MiR-136-5p expression in A431 and SCL-1 cells transfected with Vector or hsa_circ_0070934 overexpression vector was measured by qRT-PCR. (H) The transfection efficiency of si-hsa_circ_0070934 was determined by measuring hsa_circ_0070934 expression using qRT-PCR. (I) After transfecting with si-hsa_circ_0070934 or si-NC, the expression of miR-136-5p in A431 and SCL-1 cells was tested by qRT-PCR. (J and K) Relative miR-136-5p expression was determined using qRT-PCR in A431 and SCL-1 cells treated with different concentrations of GSPs. *P < 0.05.

Figure 4 Hsa_circ_0070934 sponged miR-136-5p to regulate the progression of GSPs-treated CSCC cells. A431 and SCL-1 cells were transfected with Vector, hsa_circ_0070934, hsa_circ_0070934 + NC mimic or hsa_circ_0070934 + miR-136-5p mimic, and then treated with GSPs. (A) MiR-136-5p expression was measured by qRT-PCR. MTT assay (B and C) and colony formation assay (D) were performed to measure cell viability and the number of colonies to evaluate cell proliferation. (E–G) Cell cycle process and apoptotic cells were analyzed using flow cytometry. (H–K) The numbers of migrated and invaded cells were determined using transwell assay. (L) WB analysis was used to measure the protein levels of PCNA, c-caspase 3/caspase 3 and MMP-3. *P < 0.05.
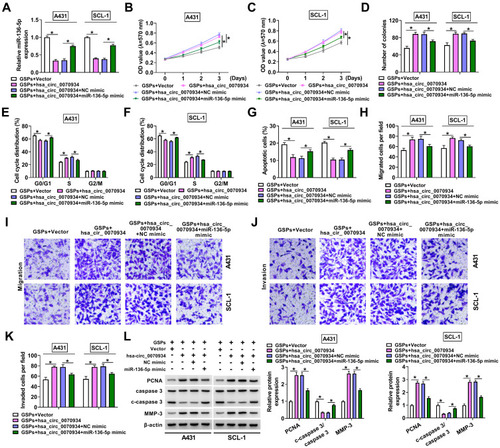
Figure 5 MiR-136-5p directly targeted PRAF2. (A) The binding sites and mutant sites between miR-136-5p and PRAF2 3ʹUTR were shown. The interaction between miR-136-5p and PRAF2 was confirmed using dual-luciferase reporter assay (B and C) and RIP assay (D and E). (F) The mRNA expression of PRAF2 was measured by qRT-PCR in A431 and SCL-1 cells transfected with NC mimic or miR-136-5p mimic. (G and H) After transfecting with NC inhibitor or miR-136-5p inhibitor into A431 and SCL-1 cells, the miR-136-5p expression and PRAF2 mRNA expression were determined using qRT-PCR. (I and J) The protein expression of PRAF2 in A431 and SCL-1 cells transfected with miR-136-5p mimic or inhibitor (or their negative controls) was detected by WB analysis. (K–N) QRT-PCR and WB analysis were used to determine the mRNA and protein expression of PRAF2 in A431 and SCL-1 cells treated with different concentrations of GSPs. (O and P) A431 and SCL-1 cells were transfected with Vector, hsa_circ_0070934, hsa_circ_0070934 + NC mimic or hsa_circ_0070934 + miR-136-5p mimic, and then treated with GSPs. The mRNA and protein expression levels of PRAF2 were assessed using qRT-PCR and WB analysis. *P < 0.05.
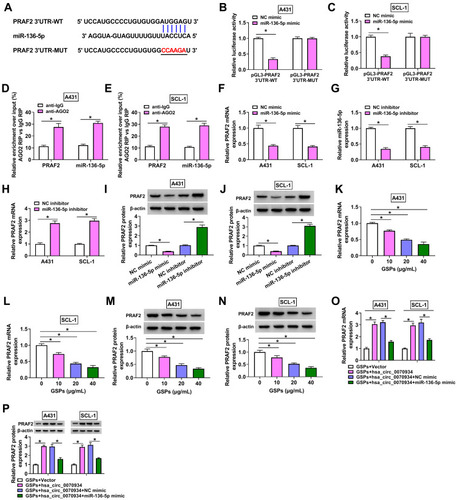
Figure 6 MiR-136-5p inhibited CSCC cell progression by targeting PRAF2. (A and B) The transfection efficiency of pcDNA PRAF2 overexpression vector was evaluated by detecting the mRNA and protein expression of PRAF2 in A431 and SCL-1 cells using qRT-PCR and WB analysis. (C and D) A431 and SCL-1 cells were transfected with NC mimic, miR-136-5p mimic, miR-136-5p mimic + pcDNA or miR-136-5p mimic + PRAF2. (C and D) The mRNA and protein expression of PRAF2 was measured by qRT-PCR and WB analysis. Cell viability and the number of colonies were analyzed using MTT assay (E and F) and colony formation assay (G) to assess cell proliferation. (H–J) Flow cytometry was utilized to detect cell cycle process and apoptotic cells. (K–M) Transwell assay was employed to evaluate the numbers of migrated and invaded cells. (N) The protein levels of PCNA, c-caspase 3/caspase 3 and MMP-3 were detected using WB analysis. *P < 0.05.
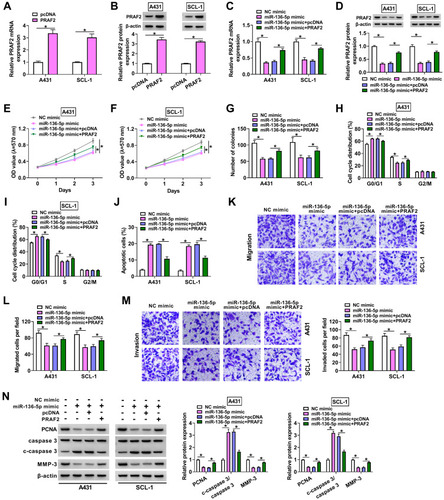
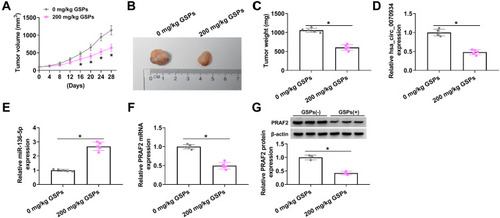
Figure 7 GSPs restrained CSCC tumor growth via regulating the hsa_circ_0070934/miR-136-5p/PRAF2 axis. A431 cells were injected into nude mice, and then the mice were given a gavage of 200 mg/kg GSPs daily (0 mg/kg GSPs was used as control group) when the tumor volume reached about 100 mm3. (A) Tumor volume was measured every 4 days. (B and C) After the tumor was removed, the tumor was photographed and weighted. (D and E) The expression of hsa_circ_0070934 and miR-136-5p was measured by qRT-PCR. (F and G) The mRNA and protein expression of PRAF2 was determined using qRT-PCR and WB analysis. *P < 0.05.