Figures & data
Table 1 Relationship Between Hsa_circ_000543 Expression and Clinical Features of Cervical Cancer Patients
Figure 1 Hsa_circ_000543 was over-expressed in CC tumor tissues and cell lines. (A) The hsa_circ_000543 expressions in 50 pairs of CC tumor tissue samples and adjacent normal tissues were measured using qRT-PCR. (B) The 50 cases of CC tissues were divided into hsa_circ_000543 high expression group and hsa_circ_000543 low expression group, the relationship between the expression of hsa_circ_000543 and the overall survival rate of CC patients was analyzed using Kaplan-Meier survival analysis. (C) The hsa_circ_000543 expression levels in the immortalized human cervical epithelial cell line H8 and four human CC cell lines (Caski, ME180, C-33A and Siha) were assessed using qRT-PCR. (D) After RNase R treatment, the levels of hsa_circ_000543 and MALAT1 mRNA were detected with qRT-PCR. Data were shown as mean ± SD. *P<0.05, **P<0.01 vs normal tissues, H8 cell lines or MALAT1 group.
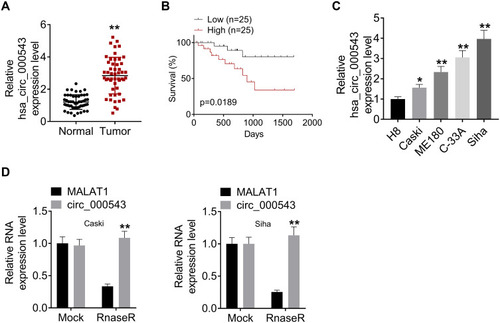
Figure 2 Hsa_circ_000543 promoted cell activities in CC. (A) The hsa_circ_000543 up-regulation and knockdown efficiency in CC cell lines were examined using qRT-PCR. (B) Cell proliferation was analyzed using CCK-8 assay. (C) Cell apoptosis was assessed by flow cytometry. (D) Cell colony formation was detected by cell colony formation assay. (E and F) Cell migration and invasion were measured by Transwell assay. Data were shown as mean ± SD. *P<0.05, **P<0.01 vs Vector or siNC groups.
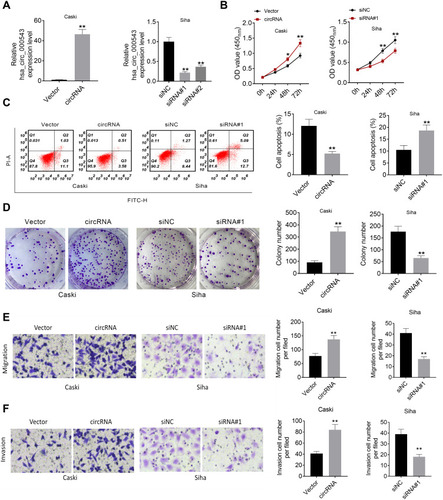
Figure 3 Hsa_circ_000543 directly bound to miR-567. The targeted miRNAs of hsa_circ_000543 were predicted using online tools. (A) The expressions of miR-338-3p, miR-567, miR-766 and miR-935 were detected using qRT-PCR. (B) The binding sites of hsa_circ_000543 on miR-567. (C) The prediction was verified using luciferase reporter assay. (D) The miR-567 expressions in 50 pairs of CC tumor tissue samples and adjacent normal tissues were measured using qRT-PCR. (E) The correlation between hsa_circ_000543 expression and miR-567 expression was analyzed via Pearson’s χ2 test. Data were shown as mean ± SD. *P<0.05, **P<0.01 vs Vector, siNC, NC mimic or Normal groups.
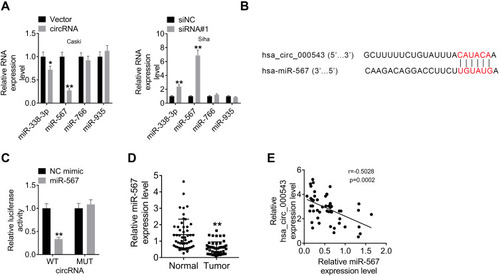
Figure 4 MiR-567 directly targeted ZNF268. (A) ZNF268 was predicted to be the downstream functional gene of miR-567 via online tools (TargetScan, miRDB, miRTarBase and miRWalk). (B) The binding sites of ZNF268 on miR-567. (C) The prediction was verified using luciferase reporter assay. (D and E) The expression of ZNF268 was detected using Western blot. (F) The ZNF268 expressions in 50 pairs of CC tumor tissue samples and adjacent normal tissues were measured using qRT-PCR. (G) The correlation between ZNF268 expression and miR-567 expression was analyzed using Pearson’s χ2 test. (H) The correlation between ZNF268 expression and hsa_circ_000543 expression were analyzed via Pearson’s χ2 test. Data were shown as mean ± SD. **P<0.01 vs NC mimic, NC inhibitor, Vector + NC mimic or Normal groups; ##P<0.01 vs circRNA + NC mimic group.
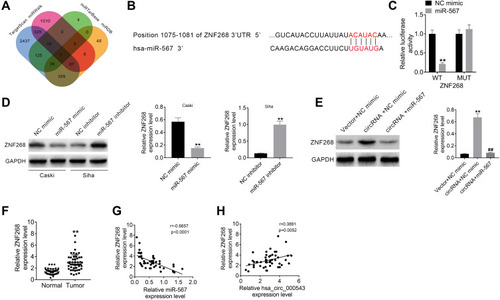
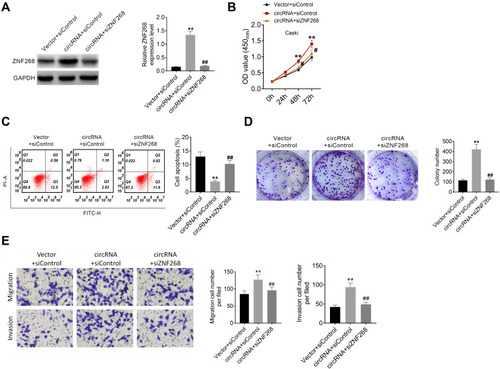
Figure 5 Hsa_circ_000543 affected CC cell activities via modulating miR-567/ZNF268 axis. (A) The expression of ZNF268 was measured using Western blot. (B) Cell proliferation was detected using CCK-8 assay. (C) Cell apoptosis was assessed using flow cytometry. (D) Cell colony formation was detected using cell colony formation assay. (E) Cell migration and invasion were measured by Transwell assay. Data were shown as mean ± SD. **P<0.01 vs Vector + siControl group; #P<0.05, ##P<0.01 vs circRNA + siControl group.