Figures & data
Figure 1 The up-regulation of P4HA2 in clinical samples of patients with EOC. (A) The normal ovarian tissues and EOC tissue were pathologically confirmed using H&E staining. Representative images were shown at 200× magnification (scale bar, 100 μm) and 400× magnification (scale bar, 50 μm). (B) The expression of P4HA2 in normal ovarian tissues and EOC tissue were detected using IHC staining. Representative images were shown at 200× magnification (scale bar, 100 μm) and 400× magnification (scale bar, 50 μm). (C) Semi-quantitative P4HA2 expression in normal ovarian tissues and EOC tissue by staining score.
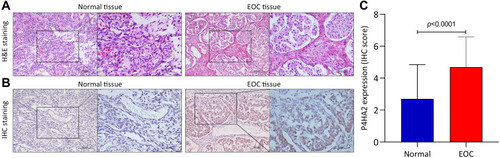
Figure 2 The up-regulation of P4HA2 in EOC patients from Oncomine database. (A) The expression of P4HA2 mRNA in Adib ovarian dataset. (B) The expression of P4HA2 mRNA in Hendrix ovarian dataset.
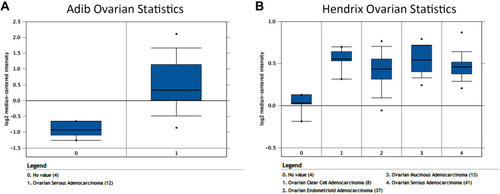
Table 1 Association Between P4HA2 Expression and Clinicopathologic Characteristics of EOC Patients
Table 2 Cox Regression Analysis for Overall Survival in Patients with EOC
Figure 3 P4HA2 expression is associated with poor prognosis in patients with EOC. (A and B) Kaplan–Meier curves of progression-free survival (A) and overall survival (B) in EOC patients categorized by P4HA2 expression; (C and D) the Kaplan–Meier plotter platform (http://www.kmplot.com) resulted that patients with the high P4HA2 expression was significantly associated with short progression-free survival (C) and poor overall survival (D) in EOC; (E) The P4HA2 expression in different pathological types. (F and G) Kaplan–Meier curves of progression-free survival (F) and overall survival (G) in HGSOC patients categorized by P4HA2 expression.
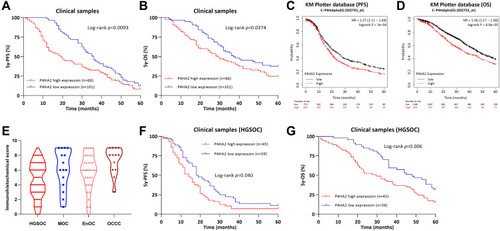
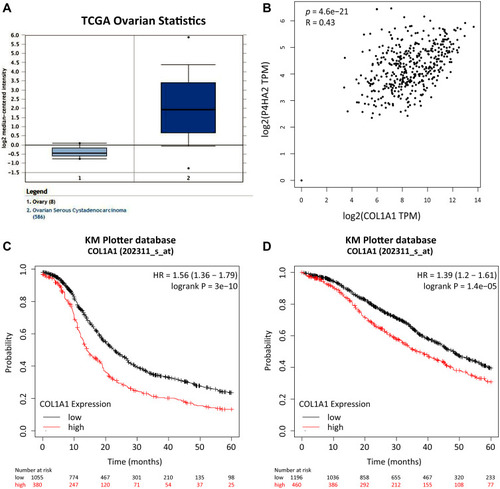
Figure 4 The relationship between P4HA2 with COL1A1. (A) The expression of COL1A1 mRNA in TCGA ovarian dataset; (B) the correlation analysis between P4HA2 and COL1A1 expression was analyzed using Spearman correlation in the GEPIA database; (C and D) the Kaplan–Meier plotter platform (http://www.kmplot.com) resulted that patients with the high COL1A1 expression was significantly associated with short progression-free survival (C) and poor overall survival (D) in EOC.