
Figures & data
Table 1 Baseline Characteristics of the Patients
Figure 1 Distribution of histological subtypes in relapsed patients.
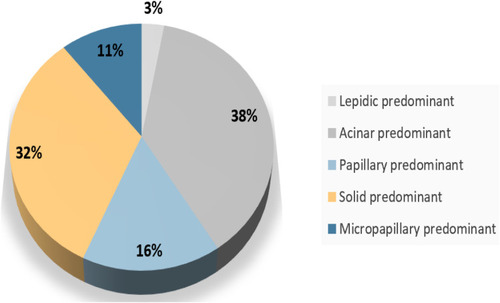
Figure 2 Flowchart of the patient selection process.
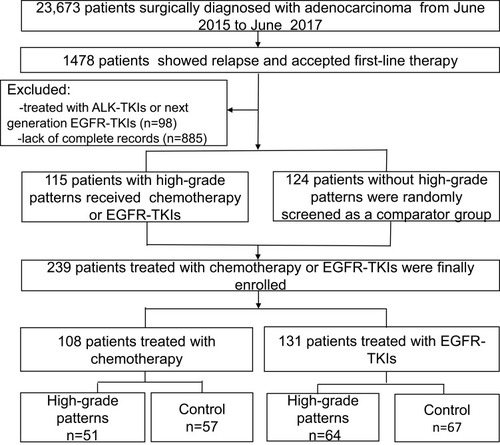
Table 2 Impact of Predictive Factors on Chemotherapy in Univariate and Multivariate Analyses (n = 108)
Figure 3 Kaplan-Meier survival curves for patients in different cohorts. (A) Progression-free survival (PFS) of first-line chemotherapy in epidermal growth factor receptor (EGFR) wild-type patients with high-grade patterns and in control subjects; (B) overall survival (OS) of first-line chemotherapy in EGFR wild-type patients with high-grade patterns and control cohorts; (C) PFS curves of first-line EGFR-tyrosine kinase inhibitor (TKI) treatment in EGFR+ patients with high-grade patterns and control cohorts; (D) OS curves of first-line EGFR-TKI treatment in EGFR+ patients with high-grade patterns and control cohorts.
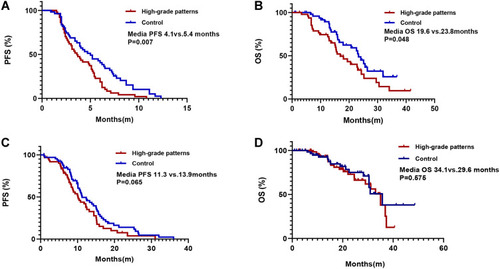
Figure 4 Response to different therapies in different cohorts. (A) Response to first-line chemotherapy in high-grade patterns and control cohorts. (B) Response to first-generation tyrosine kinase inhibitors (TKIs) in high-grade patterns and control cohorts.
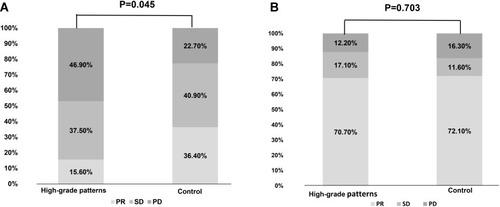
Table 3 Impact of Predictive Factors on EGFR-TKIs in Univariate and Multivariate Analyses (n = 131)