Figures & data
Table 1 Association of Clinicopathological Factors with circ_0001944 Expression in NSCLC Patients
Table 2 Primer Sequences Used for qRT-PCR
Figure 1 The prognosis of NSCLC patients with high expression of circ_0001944 was worse. (A) QRT-PCR analysis of circ_0001944 expression in 47 paired NSCLC tissues and neighbor normal tissues. (B) Kaplan-Meier survival curves showed the prognosis of NSCLC patients with high or low expression of circ_0001944. (C) Assessment of circ_0001944 expression in NSCLC cells (A549, H1975, H522, and HCC827) and the BEAS-2B cells by qRT-PCR. *P < 0.05, **P < 0.01, and ***P < 0.001.
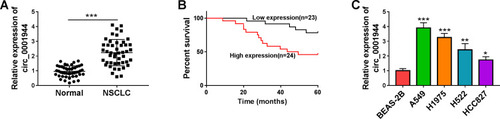
Figure 2 Circ_0001944 promoted proliferation, migration, invasion, and glycolysis of NSCLC cells. (A-K) A549 and H1975 cells were transfected with sh-circ_0001944 or sh-NC, and sh-NC was utilized as a control. (A) QRT-PCR validated the knockdown efficiency of sh-circ_0001944 in A549 and H1975 cells. (B-G) The proliferation, migration, and invasion of A549 and H1975 cells were analyzed by MTT, colony formation, and transwell assays. (H and I) Analysis of glucose uptake and lactate production in A549 and H1975 cells using an automatic biochemical analyzer. (J and K) Western blotting detected protein levels of HK2 and LDHA in A549 and H1975 cells. **P < 0.01 and ***P < 0.001.

Figure 3 Circ_0001944 was verified as a sponge for miR-142-5p. (A) The schematic figure exhibited the overlapping miRs that might interact with circ_0001944 in the Starbase and Circinteractome databases. (B and C) QRT-PCR revealed the expression of miR-142-5p and miR-665 in A549 and H1975 cells transfected with sh-circ_0001944 or sh-NC. (D) The schematic figure presented the putative binding sites of miR-142-5p on circ_0001944. (E) QRT-PCR detected the expression of miR-142-5p in A549 and H1975 cells transfected with miR-142-5p mimic or miR-NC. (F and G) The putative binding sites between miR-142-5p and circ_0001944 were verified by dual-luciferase reporter assay. (H) QRT-PCR analyzed circ_0001944 expression in Bio-miR-142-5p-wt, Bio-miR-NC, and Bio-miR-142-5p-mut groups. (I) Expression pattern of miR-142-5p in NSCLC tissues was verified by qRT-PCR. (J) Analysis of the correlation between miR-142-5p and circ_0001944 expression in NSCLC tissues by Pearson’s correlation analysis. (K) Expression trend of miR-142-5p in NSCLC cells was validated by qRT-PCR. **P < 0.01 and ***P < 0.001.
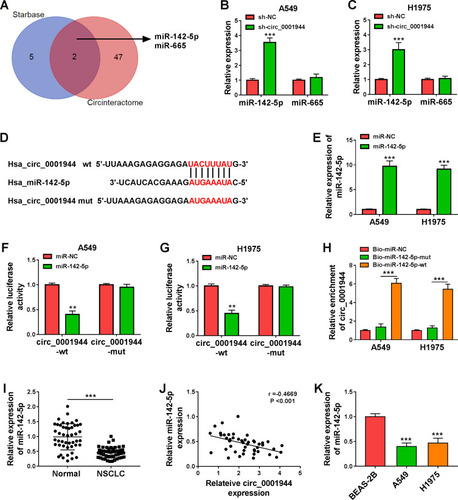
Figure 4 Circ_0001944 adsorbed miR-142-5p to regulate proliferation, migration, invasion, and glycolysis of NSCLC cells. (A) Expression level of miR-142-5p in A549 and H1975 cells transfected with anti-miR-142-5p or anti-miR-NC was analyzed by qRT-PCR. (B-J) A549 and H1975 cells were transfected with sh-NC+anti-miR-NC, sh-circ_0001944+anti-miR-NC, or sh-circ_0001944+anti-miR-142-5p. (B-F) Analysis of proliferation, migration, and invasion of A549 and H1975 cells by MTT, colony formation, and transwell assays. (G and H) Evaluation of glucose uptake and lactate production in A549 and H1975 cells using an automatic biochemical analyzer. (I and J) Protein levels of HK2 and LDHA in A549 and H1975 cells were measured by Western blotting. *P < 0.05, **P < 0.01, and ***P < 0.001.
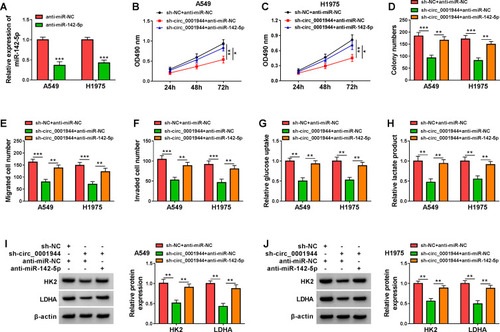
Figure 5 NFAT5 was validated as a direct target of miR-142-5p. (A) The targets of miR-142-5p predicted by bioinformatics (miRDB, Starbase, Targetscan, microT, and miRWalk) were analyzed by Venn. (B and C) Influence of miR-142-5p mimic on expression levels of NFAT5, PUM2, TRIM36, ARMC8, FBXO21, and BTBD7 in A549 and H1975 cells was assessed by qRT-PCR. (D) Schematic illustration showed the putative binding sites between NFAT5 3ʹUTR and miR-142-5p. (E and F) The putative binding sites between NFAT5 3ʹUTR and miR-142-5p were validated by dual-luciferase reporter assay. (G) QRT-PCR analysis of the expression of NFAT5 mRNA in NSCLC tissues. (H) Pearson’s correlation analysis revealed the correlation between miR-142-5p and NFAT5 in NSCLC tissues. (I and J) Western blotting revealed the protein level of NFAT5 in NSCLC tissues and cells. (K) Effect of miR-142-5p overexpression on the protein level of NFAT5 was assessed by Western blotting. *P < 0.05, **P < 0.01, and ***P < 0.001.
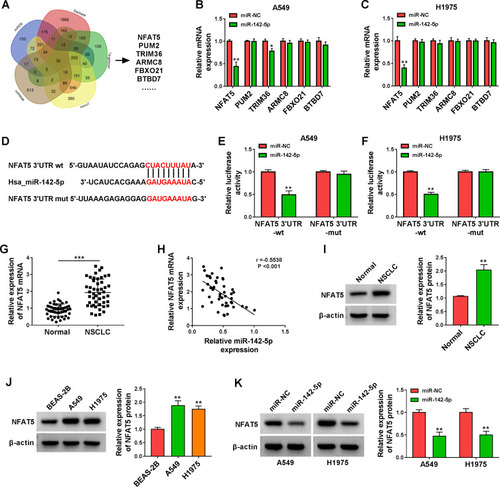
Figure 6 Circ_0001944 regulated NFAT5 expression by adsorbing miR-142-5p. (A) Pearson’s correlation analysis presented the correlation between NFAT5 and circ_0001944 in NSCLC tissues. (B) Western blotting detected the protein level of NFAT5 in A549 and H1975 cells transfected with sh-NC, sh-circ_0001944, sh-circ_0001944+anti-miR-NC, or sh-circ_0001944+anti-miR-142-5p. ***P < 0.001.
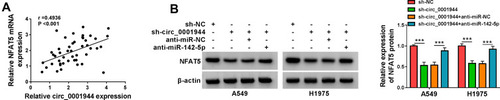
Figure 7 Circ_0001944 promoted proliferation, migration, invasion, and glycolysis of NSCLC cells through NFAT5. (A) After NFAT5 or pcDNA transfection, the level of NFAT5 protein was detected by Western blotting. (B-I) A549 and H1975 cells were transfected with sh-NC+pcDNA, sh-circ_0001944+pcDNA, or sh-circ_0001944+NFAT5. (B-F) The proliferation, migration, and invasion of A549 and H1975 cells were determined by MTT, colony formation, and transwell assays. (G and H) Analysis of glucose uptake and lactate production in A549 and H1975 cells using automatic biochemical analyzer. (I) Western blotting assessed protein levels of HK2 and LDHA in A549 and H1975 cells. *P < 0.05, **P < 0.01, and ***P < 0.001.
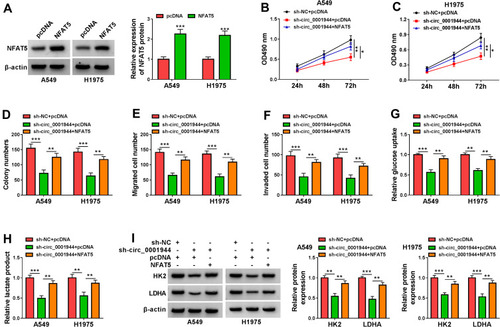
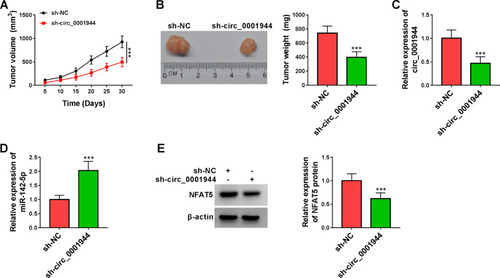
Figure 8 Circ_0001944 silencing curbed xenograft tumor growth in vivo. (A) Tumor growth curves were plotted using xenograft tumor volume data. (B) Tumor weight was assessed after tumor excision. (C and D) Expression tendencies of circ_0001944 and miR-142-5p in xenograft tumors were analyzed by qRT-PCR. (E) The level of NFAT5 protein in xenograft tumors was detected by Western blotting. ***P < 0.001.