Figures & data
Figure 1 Simple map of cell co-cultured system.
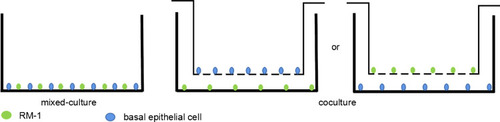
Figure 2 Identification of basal epithelial cells acquired from mouse prostate with anti-p63 in immunofluorescence assay (Objective 10X). Basal epithelial cells were specific to anti-p63 and more than 90%.
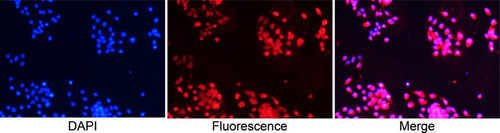
Figure 3 Normal basal epithelial cells could stimulate the migration of RM-1 directly or indirectly. (A) Effect of basal epithelial cells on cells wound healing of RM-1 was determined after being mixed-cultured (1:1) for 0 h and 24 h. (B) Quantification of migrated width of wound healing assay. (C) Effect of basal epithelial cells on migration of RM-1 was determined after being co-cultured for 20 h. (D) Quantification of migrated cells in (C). (E) Effect of 10% conditional medium of basal epithelial cells on migration of RM-1 was estimated after being cultured for 20 h. (F) Quantification of migrated cells in (E). Values are represented by mean±SD from at least three independent experiments. “*” represents “p<0.05”, “***” represents “p<0.001” vs control group.
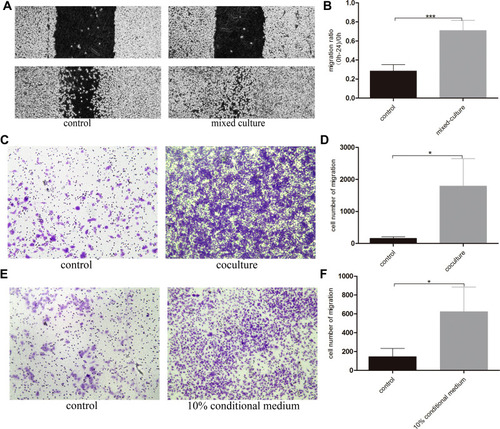
Figure 4 Normal basal epithelial cell promoted the invasion of RM-1 directly or indirectly. (A) Effect of basal epithelial cells on invasion of RM-1 was determined after being co-cultured for 20 h. (B) Quantification of invasive cells in (A). (C) Effect of 10% conditional medium of basal epithelial cells on invasion of RM-1 was estimated after being cultured for 20 h. (D) Quantification of invasive cells in (C). Values are represented by mean±SD from at least three independent experiments. “**” represents “p<0.01”, “***” represents “p<0.001” vs control group.
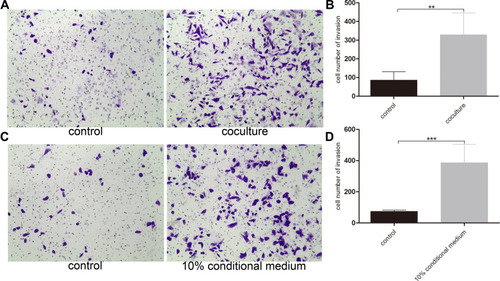
Figure 5 Basal epithelial cells secreted TGF-β1 and additional TGF-β1 stimulated the migration and invasion of RM-1. (A) Quantification of TGF-β1 levels measurement in ELISA assay. Effect of 5 ng/mL TGF-β1 on migration (B) and invasion (C) of RM-1 in transwell chamber with or without matrigel after being cultured for 20 h. (D) Quantification of invasive cells in (C). Values are represented by mean±SD from at least three independent experiments. “***” represents “p<0.001” vs control group.
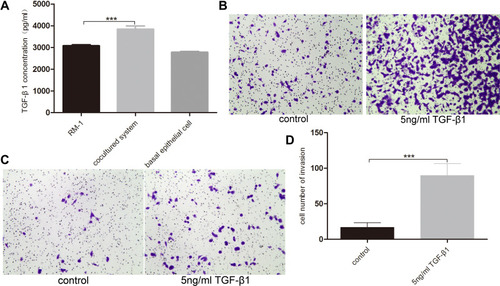
Figure 6 Basal epithelial cells secreted TGF-β1 to promote the migration and invasion of RM-1. (A) Basal epithelial cells and TGF-β1 (5 ng/mL) changed the morphology of RM-1 from cuboid to spindle-shape. (B) HE staining and immunocytochemistry with anti-63 in mixed-cultured group. Arrowhead indicates basal epithelial cell of which p63 is positive. (C) Basal epithelial cells and TGF-β1 regulated the proteins associated with EMT. (D) Quantification of relative proteins expression in (C). (E) Effect of different concentration of SB431542 on RM-1 death was measured by CCK8 assay. SB431542 (2000 nM, 4000 nM) inhibited the migration (F and G) and invasion (H and I) of co-cultured RM-1. (J) Expressions of EMT relevant proteins were down-regulated when SB431542 (2000 nM or 4000 nM) was added into medium of co-cultured cells. (K) Quantification of relative expressions of proteins in (J). Values are represented by mean±SD from at least three independent experiments. “*” represents “p<0.05”. “**” represents “p<0.01”. “***” represents “p<0.001”.
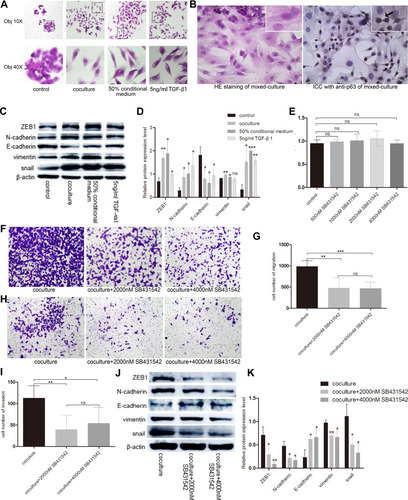
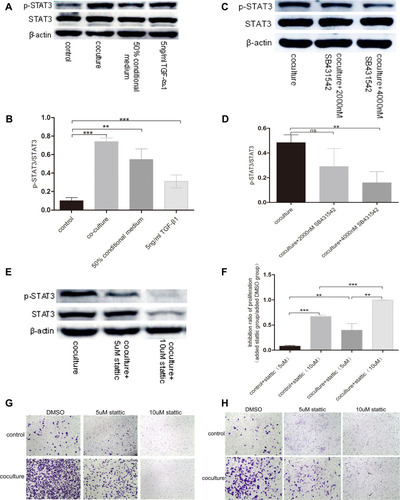
Figure 7 TGF-β1 which was secreted by basal epithelial cells could promote migration and invasion of RM-1 depending on the phosphorylation of STAT3. (A and B) p-STAT3 was up-regulated by basal epithelial cells, conditional medium of basal epithelial cells and TGF-β1. (C and D) Expression of p-STAT3 in co-cultured group was down-regulated when SB431542 was added. (E) Stattic down-regulated the expression of p-STAT3 and STAT3. Stattic inhibited the proliferation (F), migration (G) and invasion (H) of untreated RM-1 and co-cultured RM-1. Values are represented by mean±SD from at least three independent experiments. “**” represents “p<0.01”. “***” represents “p<0.001”.