Figures & data
Figure 1 Obesity promotes tumor progression and metastasis of ovarian cancer. (A) The tumor flux (counts) was observed twice per week using a bioluminescence imaging system. The first week was defined as days 1 to 8. Fluorescent intensity (counts) from tumors in the two groups was compared at week 3 (n = 3 mice/per group); t-test. (B) Fluorescent intensity (counts) in the two groups was compared during weeks 1–3 twice per week (n = 3 mice/per group); t-test. (C) Typical images of mice from the two groups displaying tumors in the enterocoelia. (D) H&E staining of the peritoneum, diaphragm, and mesentery tissue in the two groups. *P < 0.05, **P < 0.01, ***P < 0.001.
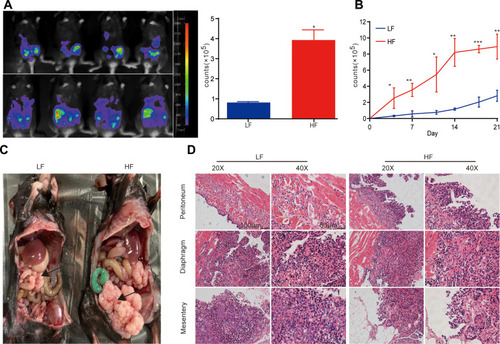
Figure 2 Obesity upregulates the proportion of MDSC in peripheral blood in mice. (A) Weight curves in DIO model mice. Five-week-old female BL6 mice were fed an LF or HF diet for 18 weeks. n=5 mice per group; means ± s.e.m. (B) Representative flow cytometry plots of myeloid-derived suppressor cells (MDSCs) from peripheral blood. (C) Flow cytometry plots of MDSCs in peripheral blood in the DIO model after 18 weeks. n=5 mice per group. (D) Weight curves in OB/OB model mice. Female OB/OB or wild-type (WT) mice were fed a normal diet until a predefined weight endpoint of >40g. n=5 mice per group; means ± s.e.m. (E) Representative flow cytometry plots, as displayed in (B). (F) Flow cytometry plots of MDSCs in peripheral blood in the Ob/Ob model after 6 weeks. n=5 mice per group. (G) Weight curves for Balb/c model mice. Five-week-old female Balb/c mice were fed an LF or HF diet for 18 weeks. n=5 mice per group; means ± s.e.m. (H) Representative flow cytometry plots, as displayed in (B). (I) Flow cytometry of MDSCs in peripheral blood in Balb/c model mice after 18 weeks. n=5 mice per group. t test, *P < 0.05, **P < 0.01.
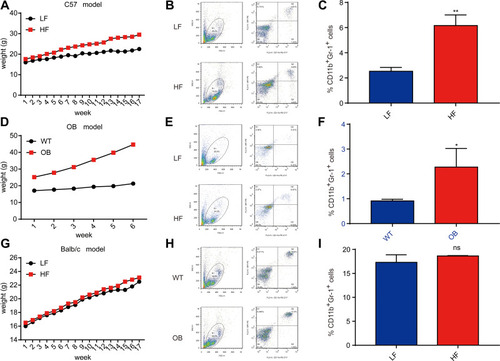
Figure 3 Obesity upregulates cytokine levels in peripheral blood, bone marrow, and ovarian tissue in mice. ELISA analyses of the cytokine expression: (A) CCL25, (B) CD40L, (C) GM-CSF, (D) IL-5, (E) IGFBP2, (F) IL-6, (G) MMP3, (H) MMP9. t-test, *P < 0.05, **P < 0.01, ***P < 0.001.
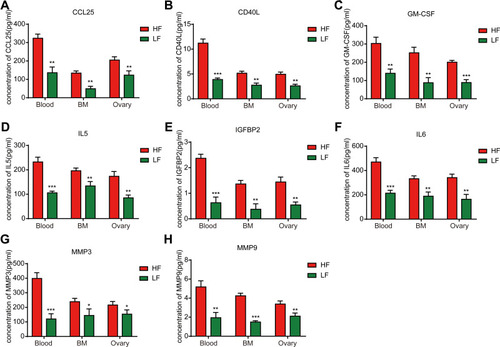
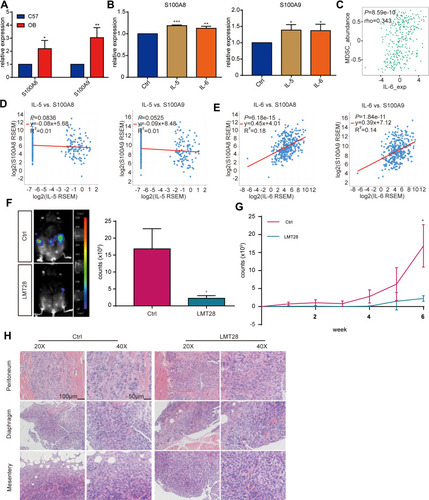
Figure 4 Obesity can enhance MDSC immune suppression via IL-6 in the tumor microenvironment. (A and B) Quantitative real-time PCR analysis of S100A8 and S100A9 expression in MDSCs from the bone marrow of different groups, t test. *P < 0.05, **P < 0.01, ***P < 0.001. (C) Relationship between MDSCs and IL-6. The relationship between S100A8, S100A9 and cytokines: (D) IL-5, (E) IL-6. (F) Fluorescent intensity (counts) from tumors in the two groups was compared at week 6 (n = 3 mice/per group); t-test. (G) Fluorescent intensity (counts) in the two groups was compared during weeks 1–6 (n = 3 mice/per group); t-test. (H) H&E staining of the peritoneum, diaphragm, and mesentery tissue in the two groups. *P < 0.05, **P < 0.01, ***P < 0.001.