Figures & data
Table 1 Baseline Characteristics of Patients (n=169)
Table 2 Baseline Characteristics of Patients in Unknown/No/Low PD-L1 Group (n=121)
Table 3 Baseline Characteristics of Patients in High PD-L1 Group (n=48)
Figure 1 Response comparison of patients with hypercholesterolemia or hypocholesterolemia based on the ICI-based treatment.
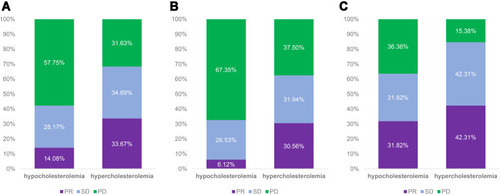
Figure 2 Survival analysis of patients with hypercholesterolemia or hypocholesterolemia based on the ICI-based treatment.
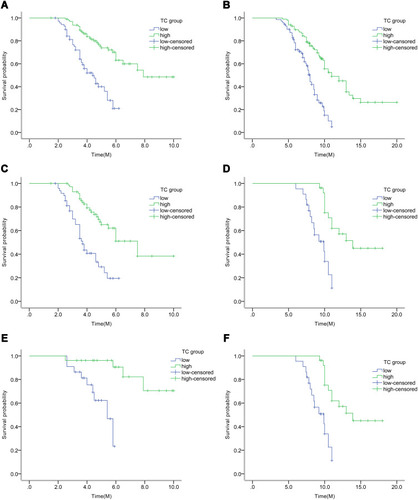
Table 4 Univariate and Multivariate Analyses of Clinical Parameters of PFS in Overall Patients
Table 5 Univariate and Multivariate Analyses of Clinical Parameters of OS in Overall Patients
Table 6 Univariate and Multivariate Analyses of Clinical Parameters of Objective Response in Overall Patients
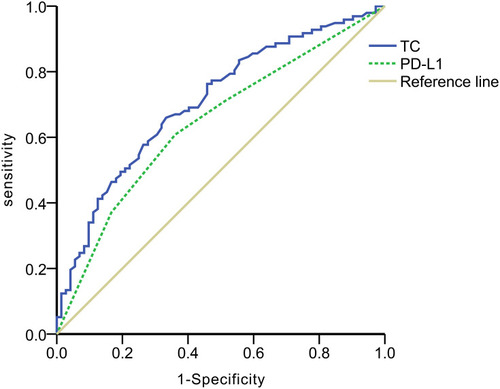
Figure 3 Predictive value of serum cholesterol and PD-L1 expression in advanced NSCLC patients based on the ICI-based treatment.