
Figures & data
Figure 1 Flow diagram showed selection criteria.
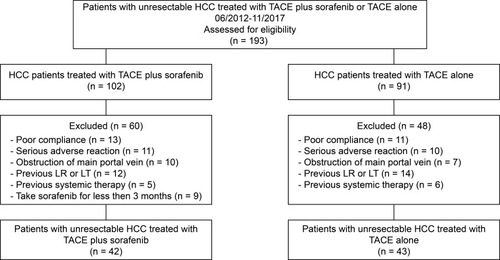
Table 1 Baseline Demographic and Clinical Characteristics of Patients Enrolled in This Study
Table 2 The Hepatocellular Carcinoma (HCC) Status of the Transarterial Chemoembolization Plus Sorafenib and Transarterial Chemoembolization Alone Groups
Table 3 Outcomes in Patients Randomized to the TACE Plus Sorafenib and TACE Alone Groups
Figure 2 Computed tomography image of the liver obtained from a 55-year-old male patient with a history of hepatitis B for 30 years. Contrast-enhanced CT imaging showed the presence of hepatocellular carcinoma with tumor thrombus in the right branch of the hepatic and portal veins (A and B). After 6 months of oral sorafenib combined with TACE, contrast-enhanced CT imaging showed tumor necrosis in the liver, and no blood supply was seen in the hepatic vein and PVTT (C and D).
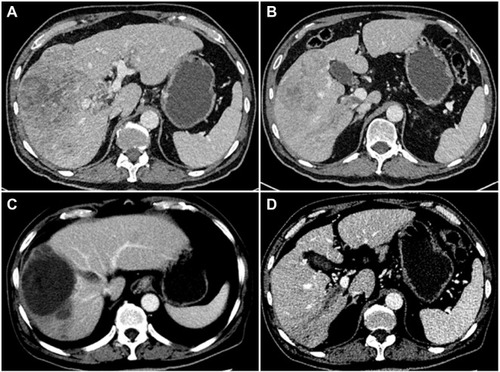
Figure 3 Computed tomography images of the chest and liver obtained from a 51-year-old male patient who had been treated with transarterial chemoembolization alone for 7 months. Although the intrahepatic lesions were controlled (A), there were right-sided pleural metastases (B, arrow shown) and bilateral lung metastases (C and D, arrow shown).
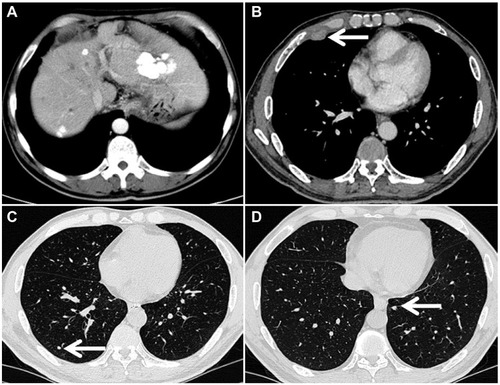
Figure 4 Kaplan–Meier plots of median (A) progression-free survival and (B) OS in the TACE plus sorafenib and TACE alone groups.
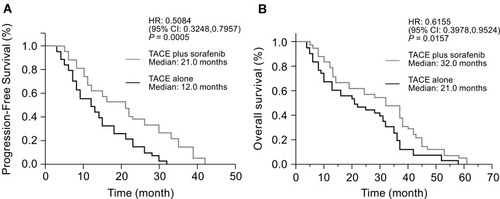
Table 4 Comparison of Biochemical Indices Before and After the First Transarterial Chemoembolization Procedure
Table 5 Comparison of Biochemical Indices Before and After the First TACE Treatment Between the TACE Plus Sorafenib and TACE Alone Treatment Groups
Table 6 Adverse Events Related to Sorafenib
Table 7 Comparison of TACE-Related Adverse Reactions Between the TACE Plus Sorafenib and TACE Alone Treatment Groups