Figures & data
Figure 1 MAGI1‐IT1 is upregulated in GC cells and tissues. (A) qPCR was used to gauge MAGI1‐IT1 expression in pairs of GC patient tumor and paracancerous tissues. (B) MAGI1‐IT1 expression was examined by qPCR in the AGS, MKN-74, MKN-45, and MGC-803 GC cells and the control GES-1 cells. (C) Kaplan-Meier curves were used to assess the link between elevated MAGI1‐IT1 expression and poor GC patient prognosis. *P < 0.05.
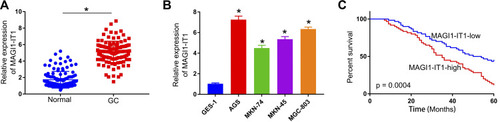
Figure 2 MAGI1‐IT1 knockdown impairs in vitro and in vivo GC cell proliferation. (A) qPCR was used to assess MAGI1‐IT1 expression following sh-MAGI1-IT1 transfection. (B) CCK-8 assays were used to assess GC cell proliferation at the indicated time points after MAGI1‐IT1 knockdown. (C) Tumor size was measured every 7 days. (D) Overall murine survival was assessed for control mice and those bearing tumors in which MAGI1‐IT1 had been knocked down. *P < 0.05.
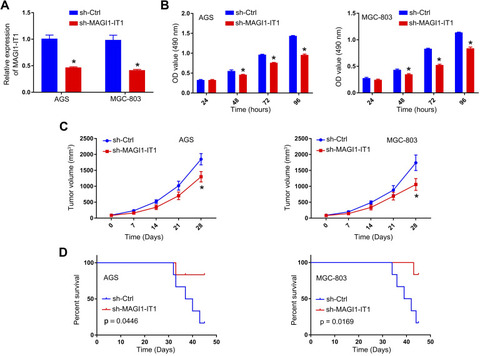
Figure 3 MAGI1‐IT1 directly binds miR-302d-3p. (A) Starbase v2.0 was used to predict the indicated binding sites capable of facilitating MAGI1‐IT1 interactions with miR-302d-3p. (B) 293T cells were used to confirm the identified binding sites via a luciferase reporter assay. (C) qPCR was used to evaluate miR-302d-3p expression following MAGI1-IT1 knockdown. (D) A RIP assay was conducted in GC cells to assess MAGI1‐IT1 and miR-302d-3p interactions within the Ago2 complex. (E) qPCR was used to evaluate miR-302d-3p levels in GC patient tumor and paracancerous tissues. (F) Pearson analyses revealed MAGI1‐IT1 and miR-302d-3p levels to be negatively correlated within GC tissues. *P < 0.05.
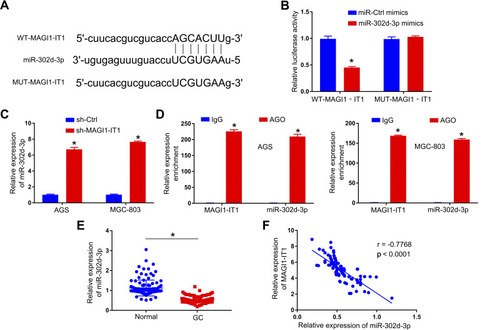
Figure 4 MAGI1‐IT1 sequesters miR-302d-3p and thereby regulates the proliferation of GC cells. (A) Cells were transfected with miR-302d-3p inhibitors or controls, after which the expression of this miRNA was assessed. (B) CCK-8 assays were used to assess relative cell proliferation following MAGI1‐IT1 knockdown in the presence or absence of miR-302d-3p inhibitor transfection. *P < 0.05.
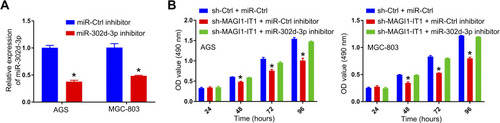
Figure 5 IGF1 is a miR-302d-3p target. (A) Target Scan was used to identify putative binding sites for miR-302d-3p and IGF1. (B) 293T cells were used to confirm the identified binding sites via a luciferase reporter assay. IG1 levels were assessed via qPCR (C) and ELISA (D) in GC cells following miR-302d-3p mimic or control transfection. (E) Relative IGF1 expression in GC patient tumor and paracancerous tissues was assessed via qPCR. (F) Pearson analyses revealed miR-302d-3p and IGF1 levels to be negatively correlated in GC tissues. *P < 0.05.
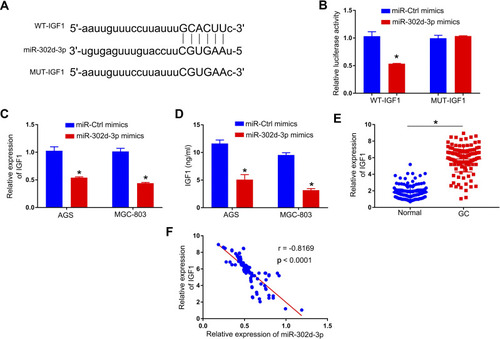
Figure 6 GC cell proliferation is suppressed via miR-302d-3p-mediated IGF1 downregulation. (A) qPCR and ELISAs (B) were used to assess IGF1 expression in cells treated with the indicated constructs, and (C) cellular proliferation was evaluated via CCK-8 assay. *P < 0.05.
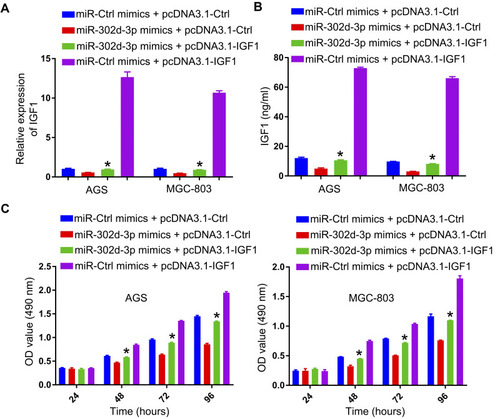
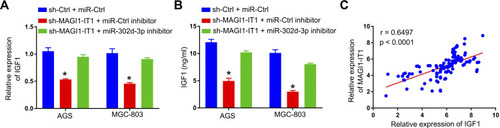
Figure 7 MAGI1‐IT1 upregulates IGF1 in a miR-302d-3p-dependent fashion. IGF1 levels were assessed via qPCR (A) and ELISA (B). (C) A Pearson correlation analysis revealed IGF1 and MAGI1‐IT1 expression to be positively correlated in GC tissues. *P < 0.05.