
Figures & data
Table 1 Clinicopathological Characteristics of NSCLC Patients and Expression of miR-183-3p and miR-182-5p in Tumor Tissues
Table 2 Clinicopathological Characteristics of NSCLC Patients and miRNA Expression in Non-Malignant Tissues
Figure 1 Relative miR-183-3p or miR-182-5p expression in cancer and normal tissues detected by RT-qPCR. (A and B) Relative miR-183-3p and miR-182-5p expression in cancer and normal tissues of the included patients. **Statistical significance P < 0.01. (C and D) Relative miR-183-3p and miR-182-5p expression in the NSCLC TNM stage I, stage II and stage III+IV groups. (E and F) Relative miR-183-3p and miR-182-5p expression in cancer and normal tissues of different histologic types. (G and H) Figure 1G. Relative miR-183-3p and miR-182-5p expression in cancer and normal tissues of nonsmokers and smokers. *Statistical significance P < 0.05. **Statistical significance P < 0.01.
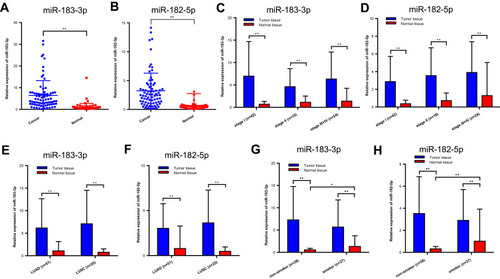
Figure 2 Relative miR-183-3p or miR-182-5p expression in NSCLC cell lines and BEAS-2B cells detected by RT-qPCR. (A) Relative miR-183-3p expression in various NSCLC cell lines and BEAS-2B cell lines. *Statistical significance P < 0.05. **Statistical significance P < 0.01. (B) Relative miR-182-5p expression in various NSCLC cell lines and BEAS-2B cell lines. **Statistical significance P < 0.01.
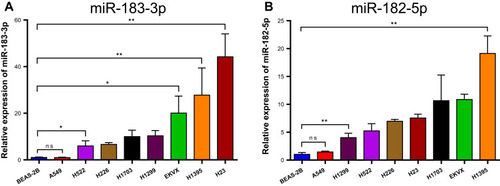
Figure 3 Correlation between the relative expression of miR-183-3p and miR-182-5p detected by RT-qPCR. (A) Correlation between relative miR-183-3p expression and relative miR-182-5p expression. (B) Relative miR-182-5p expression in a miR-183-3p overexpression or suppression cell model. H23 or H226 control, H23 or H226 cell lines transfected with RNA-TransMate only. H23 si-miR-183-3p, H23 cell line transfected with the miR-183-3p inhibitor. H226 miR-183-3p OE, H226 cell line transfected with the miR-183-3p mimic. *Statistical significance P < 0.05. **Statistical significance P < 0.01.
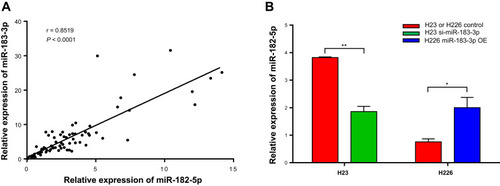
Figure 4 Proliferation ability changes in the miR-183-3p overexpression or suppression cell models. (A–C) CCK-8 assays were performed to measure the proliferation abilities of A549, H226 and BEAS-2B cells transfected with the miR-183-3p mimic. miR-183-3p OE, cells transfected with the miR-183-3p mimic. (D) CCK-8 assays were performed to measure the proliferation ability of H1395 cells transfected with the miR-183-3p inhibitor. si-miR-183-3p, cells transfected with the miR-183-3p inhibitor. (E–G) Colony formation assays were conducted to measure the proliferation abilities of A549, H226 and BEAS-2B cells transfected with the miR-183-3p mimic. Significant differences could be observed from representative pictures of culture plates (E), number of colonies (F) and colony formation rate (G). miR-183-3p OE, cells transfected with the miR-183-3p mimic. *Statistical significance P < 0.05. **Statistical significance P < 0.01. (H–J) Colony formation assays were conducted to measure the proliferation ability of H1395 cells transfected with the miR-183-3p mimic. Significant differences could be observed from representative pictures of culture plates (H), number of colonies (I) and colony formation rate (J). si-miR-183-3p, cells transfected with the miR-183-3p inhibitor. *Statistical significance P < 0.05.
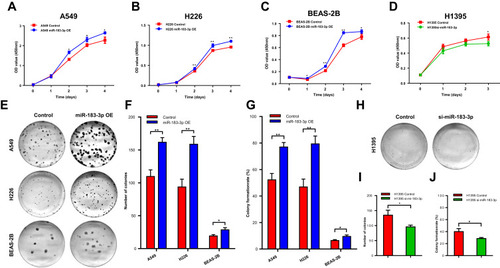
Figure 5 Bioinformatics analysis of the clinicopathological significance and prognostic value of miR-183-3p in TCGA database. (A–C) Relative miR-183-3p expression among different tumor sizes (A), histological types (B) and smoking histories (C). **Statistical significance P < 0.01. (D–F) Kaplan-Meier curves of NSCLC cases in TCGA database stratified by miR-183-3p expression (bottom 10% [n = 96] versus top 10% [n = 96]) (D). Further respective analysis in LUAD cases (E) and LUSC cases (F) showed different prognostic value.
![Figure 5 Bioinformatics analysis of the clinicopathological significance and prognostic value of miR-183-3p in TCGA database. (A–C) Relative miR-183-3p expression among different tumor sizes (A), histological types (B) and smoking histories (C). **Statistical significance P < 0.01. (D–F) Kaplan-Meier curves of NSCLC cases in TCGA database stratified by miR-183-3p expression (bottom 10% [n = 96] versus top 10% [n = 96]) (D). Further respective analysis in LUAD cases (E) and LUSC cases (F) showed different prognostic value.](/cms/asset/4696f161-4cf3-46ff-ad0a-08bfc53990a9/dcmr_a_12189638_f0005_c.jpg)