Figures & data
Table 1 The One-way Analysis of Variance on TLR9 and RUNX3 Expression in Lung Cancer Tissues
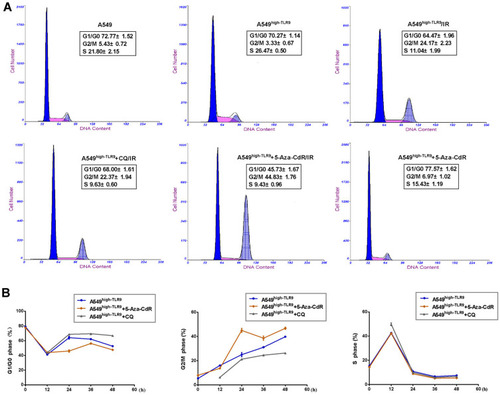
Figure 1 The expression of TLR9 and RUNX3 in lung cancer tissues (immunohistochemical SP method). Expression of TLR9 in tumor tissues (T1-T4) and RUNX3 in adjacent to cancer (R1-R5) was examined with DAB magnification 400Ẋ. Compared with normal bronchoalveolar cells, tumor cells became larger in volume and abnormally clumped together. TLR9 protein stained yellow or brown distributed equality in cytoplasm of tumor cells with unusual karyomegaly, multileaf nuclear and nuclear membrane thickened, etc. RUNX3 protein stained yellow or brown granular distributed in nucleus.
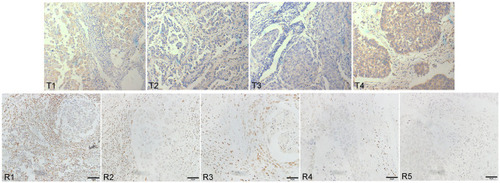
Table 2 The Correlation of TLR9 Expression in Cancer Tissues and Postoperative Survival
Table 3 The Effect of TLR9 and RUNX3 Expression on Postoperative Radiotherapy Survival of Lung Cancer
Figure 2 The survival function of lung cancer postoperation related TLR9 expression. X axis was identified for TLR9 status, Y axis indicated the cumulative survival of PFS and OS on lung cancer postoperation and radiotherapy respectively.
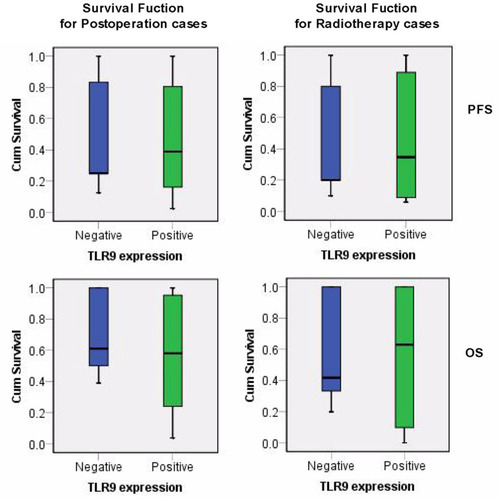
Figure 3 The survival function of lung cancer radiotherapy related TLR9 and RUNX3 expression. X axis was identified for RUNX3 status, Y axis indicated the cumulative survival of PFS and OS on lung cancer radiotherapy with negative and positive TLR9 expression.
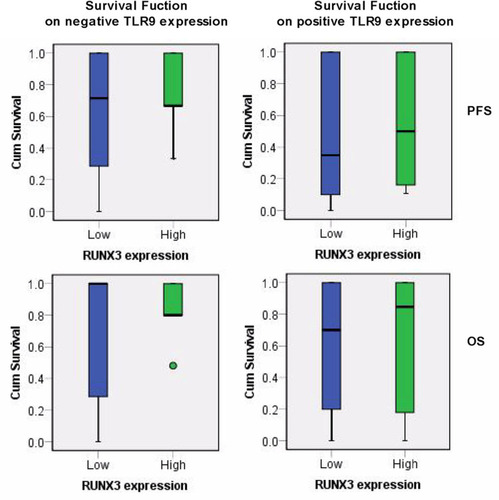
Figure 4 RUNX3 and TLR9 expression in cells before and after radiotherapy. The levels of RUNX3 and TLR9 protein in experimental cells were detected by Western blotting. RUNX3-A and RUNX3-B standard for the larger and smaller molecular weight band separately. The levels of TLR9 protein in the A549high-TLR9 cell was significantly more than in the A549 cell, t=4.081 and P<0.01. It indicated that TLR9 signaling activated in A549 cells exposure repeatedly. The result displayed that RUNX3 protein especially RUNX3-B was increased in 5-Aza-CdR treatment cells. In comparison with the A549high-TLR9 cell, the increasing levels of RUNX3-B protein was significant, with the t value 3.785 and P<0.05. The decreased levels of RUNX3 protein in cells after irradiation was observed with no difference.
Abbreviations: IR, irradiation; A549high-TLR9 cell, A549 cell with TLR9 signal activation; 5-Aza-CdR, 5-Aza-2ʹ-deoxycytidine; CQ, chloroquine.
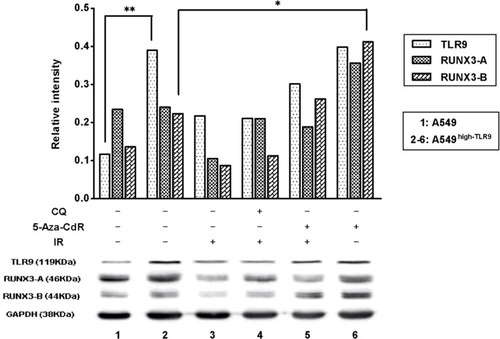
Figure 5 Comparison of cell distribution on experimental cells before and after radiotherapy. The cycle distribution in experimental cells before and after radiotherapy (A). The proportion of G2/M cells in 5-Aza-CdR treatment at irradiation 24 h was 44.83±1.76, twice that of solely irradiated cells significantly, t=15.52 and P<0.001. It maintained for irradiation 36 h and 48 h (B). The G1/G0 cells in 5-Aza-CdR adjuvant radiotherapy remained low for irradiation 48 h. The cells ratio in S phase in chloroquine combining radiotherapy at irradiation 12 h was 15.43±1.19, which was significantly more than the solely irradiated cells, P<0.001. The result was that after irradiation more cells kept in G2/M phase in 5-Aza-CdR treatment group as well more cells in S phase in chloroquine combining radiotherapy.