
Figures & data
Table 1 Patients Demographics and Disease Characteristics
Table 2 The Relationship Between the Expression of HOXA9 and Clinical Pathological Characteristics of Nasopharyngeal Carcinoma
Table 3 Expression of HOXA9 in Nasopharyngeal Carcinoma and Chronic Nasopharyngitis
Figure 1 Immunohistochemical staining for expression of HOXA9 in nasopharyngeal carcinoma (NPC) and mucosal tissue of chronic nasopharyngitis (SP×400). (A) low HOXA9 expression in mucosal tissue of chronic nasopharyngitis. (B) low HOXA9 expression in NPC tissue. (C) high HOXA9 expression in NPC tissue.
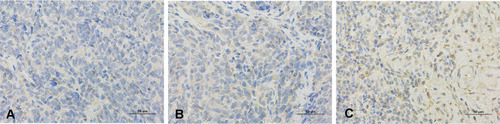
Table 4 Correlation of HOXA9 Expression in Nasopharyngeal Carcinoma with EB Virus Infection
Figure 2 Kaplan-Meier survival curves for nasopharyngeal carcinoma patients exhibiting low versus high HOXA9 expression. (A) Progress free survival. (B) Overall survival. P value were obtained using the Log rank test.
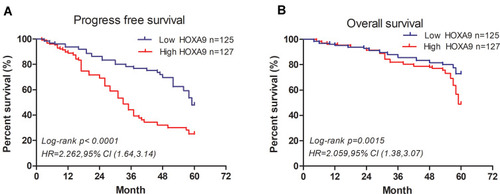
Table 5 Cox Risk Regression Model for Single Factor Analysis of Factors Affecting the Prognosis of Patients with Nasopharyngeal Carcinoma
Table 6 Cox Risk Regression Model for Multivariate Survival Analysis of Factors Affecting the Prognosis of Patients with Nasopharyngeal Carcinoma