Figures & data
Table 1 Relationship Between TUSC7 Expression and Clinicopathological Features in Breast Cancer Patients (N=90)
Figure 1 The expression pattern of TUSC7 in breast cancer. (A) RT-qPCR of TUSC7 expression in 43 breast cancer tissues compared with adjacent normal tissues. GADPH was used as normalization control. (B) RT-qPCR of TUSC7 expression in a panel of breast cancer cell lines: HCC1937, MDA-MB-468, MDA-MB-231, MDA-MB-453, T47D, SK-BR-3, MCF-7 cells. GADPH was used as normalization control. (C) The low expression level of TUSC7 is correlated with poor overall survival in TNBC patients. Kaplan–Meier curve for overall survival in patients with low (n=45) versus high (n=45) TUSC7 expression. Corresponding P values were analyzed by Log rank test. ***P<0.0001.
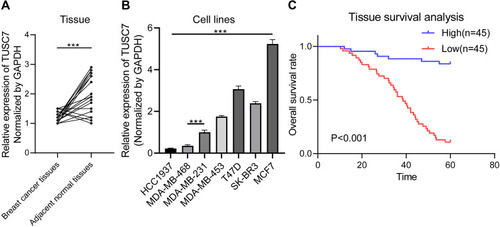
Table 2 Results of the Multivariate Analyses of TUSC7 in 90 Patients with Breast Cancer
Figure 2 The effects of TUSC7 knockdown on the growth, migration and invasion of triple negative breast cancer (TNBC) cells. (A) The knockdown of TUSC7 by shRNA was performed using shRNA sequences. TUSC7 shRNAs and scrambled sequences (scramble) were transfected into MDA-MB-231 cells and knockdown was confirmed by qRT-PCR. (B) CCK8 assays. Cell growth of MDA-MB-231 cells transfected with TUSC7 shRNAs or control shRNAs for 5 days. (C) Cell cycle analysis of MDA-MB-231 cells transfected with TUSC7 shRNAs or scrambled shRNAs for five days. (D and E) Transwell migration and invasion assays of MDA-MB-231 cells transfected with TUSC7 shRNAs or scrambled shRNAs for five days. Magnification, 100X. **P<0.001; ***P<0.0001.
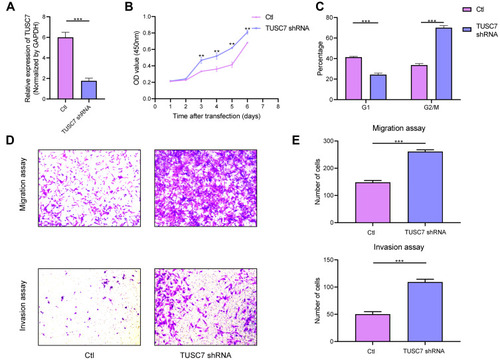
Figure 3 The effects of TUSC7 overexpression on the growth, migration and invasion of TNBC cells. (A) The Overexpression of TUSC7 was performed by transfecting MDA-MB-468 cells with the TUSC7-DOX vector (TUSC7 Over). Expression was confirmed by qRT-PCR. (B) CCK8 assays. MDA-MB-231 cells were transfected with TUSC7-DOX (TUSC7 Over) or scramble vector for five days. (C) Cell cycle analysis of MDA-MB-231 cells transfected with TUSC7-DOX (TUSC7 Over) or scramble vector for 5 days. (D and E) Transwell migration and invasion assays of MDA-MB-231 cells transfected with TUSC7-DOX (TUSC7 Over) or scramble vector for 5 days. Magnification, 100X. **P<0.001; ***P<0.0001.
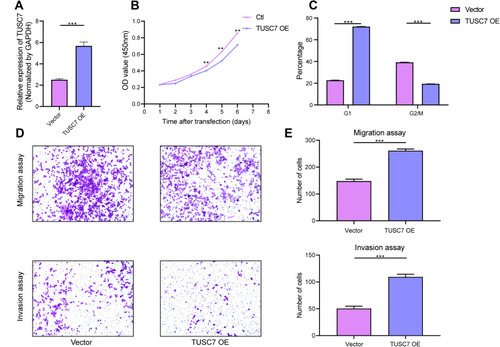
Figure 4 TUSC7 inhibits tumor growth in a xenograft mouse model. Scrambled shRNA control, TUSC7 shRNA, TUSC7 scramble vector or TUSC7-DOX-expressing MDA-MB-468 cells were injected into the flank of nude mice (n = 6, each group). After 32 days, the tumors were removed. The tumorigenesis rate was 100% for each group. (A) Tumor volume. (B) Tumor growth curves. Data are presented as the average ± s.d. of 6 tumors for each group. *P < 0.05; **P<0.001; P<0.0001. (C) Tumor weights were measured when tumors were harvested. Error bars represent SEM, n = 6. ***P<0.0001. (D) Tumor volume. (E) Tumor growth curves. Data are presented as the average ± s.d. of six tumors for each group. *P < 0.05; **P<0.001; P<0.0001. (F) Tumor weights were measured when tumors were harvested. Error bars represent SEM, n = 10. ***P<0.0001.
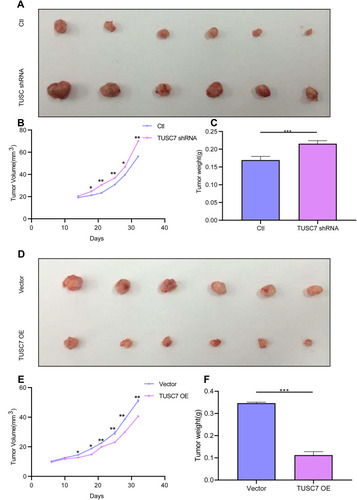
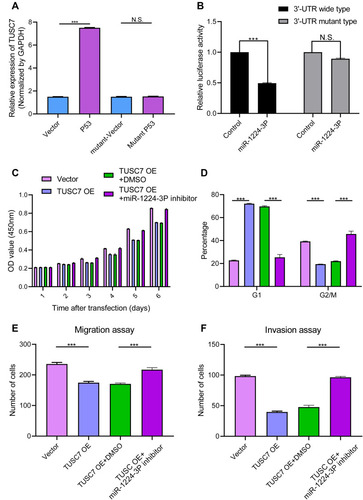
Figure 5 (A) Induction of TUSC7 by ectopically expressed p53. MDA-MB-231 cells were transfected with empty vector or plasmids expressing wild-type p53 or mutant p53 (R175H) overnight. After changing medium, the cells were cultured for another 24 h before qRT-PCR for TUSC7. Error bars represent SEM, n = 3. ***P<0.0001, NS, non significant. (B) TUSC7 is a direct target of miR-1224-3P. MDA-MB-231 cells were transfected with luciferase reporters with the wild-type TUSC7 3′-UTR or TUSC7 mutant 3′-UTR together with the miR-1224-3P mimics or control oligonucleotides. Renilla luciferase activity was normalized to firefly luciferase activity. Error bars represent SEM, n = 3. NS, non significant, ***P<0.0001. (C) CCK8 assays. The miR-1224-3P inhibitor could reverse the effect of TUSC7 on the growth of MDA-MB-231 cell lines. Error bars represent SEM, n = 3. (D) Cell cycle assays. The miR-1224-3P inhibitor could reverse the effect of TUSC7 on the cell cycle of MDA-MB-231 cell lines. Error bars represent SEM, n = 3. ***P<0.0001. (E) Migration assays. The miR-1224-3P inhibitor could reverse the effect of TUSC7 on the migration ability of MDA-MB-231 cell lines. Error bars represent SEM, n = 3. ***P<0.0001. (F) Invasion assays. The miR-1224-3P inhibitor could reverse the effect of TUSC7 on the invasion ability of MDA-MB-231 cell lines. Error bars represent SEM, n = 3. ***P<0.0001.