
Figures & data
Figure 1 Inclusion criteria and exclusion criteria of patients who underwent gastrectomy.
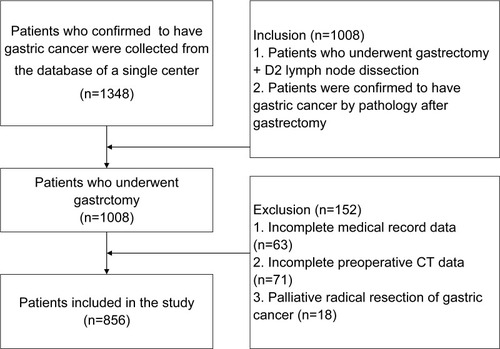
Table 1 Definitions of Arterial Calcification on Preoperative CT Images
Figure 2 Examples of calcification on preoperative CT images in patients with gastric cancer. (A) Image showing the descending aorta with a plaque and calcified foci (arrow). (B) Image showing calcification of the celiac axis (arrow). (C) Image showing calcification of the splenic artery (arrow). (D) Image showing calcification of the common hepatic artery (arrow). A calcification score of 1 was assigned to the above four images.
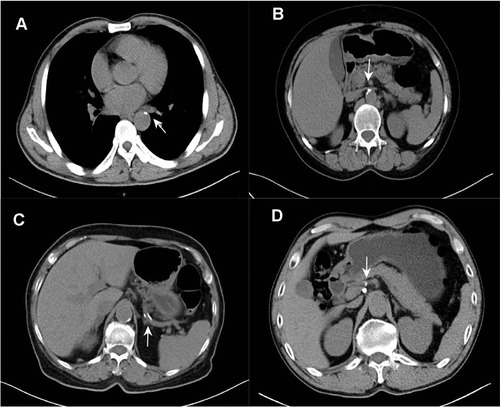
Table 2 Baseline Characteristics
Table 3 Surgical Information
Table 4 Calcification Score of Patients with/without Anastomotic Leakage
Table 5 Multivariate Logistic Regression Analysis Revealed Independent Factors Associated with Anastomotic Leakage